\n
## Line Chart: Llama-3.1-8B Performance Over Iterations
### Overview
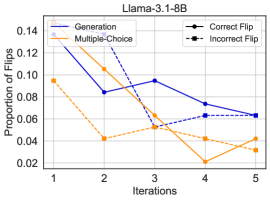
This line chart depicts the performance of the Llama-3.1-8B model across five iterations, measuring the proportion of flips for different evaluation methods: Generation, Multiple-Choice, Correct Flip, and Incorrect Flip. The chart aims to show how the model's performance changes with each iteration.
### Components/Axes
* **Title:** Llama-3.1-8B
* **X-axis:** Iterations (labeled 1, 2, 3, 4, 5)
* **Y-axis:** Proportion of Flips (scale from 0.02 to 0.14)
* **Legend:**
* Generation (Solid Blue Line)
* Multiple-Choice (Solid Orange Line)
* Correct Flip (Black Line with Circle Markers)
* Incorrect Flip (Black Dashed Line)
### Detailed Analysis
The chart displays four distinct lines representing the proportion of flips for each method over the five iterations.
* **Generation (Solid Blue Line):** This line starts at approximately 0.12 at iteration 1, decreases to around 0.08 at iteration 2, rises to approximately 0.10 at iteration 3, then declines to roughly 0.07 at iteration 4, and finally settles around 0.065 at iteration 5. The overall trend is slightly downward.
* **Multiple-Choice (Solid Orange Line):** This line begins at approximately 0.10 at iteration 1, drops sharply to around 0.04 at iteration 2, continues to decrease to approximately 0.02 at iteration 4, and then slightly increases to around 0.04 at iteration 5. This line shows a significant downward trend.
* **Correct Flip (Black Line with Circle Markers):** This line starts at approximately 0.08 at iteration 1, remains relatively stable around 0.08 at iteration 2, increases to approximately 0.09 at iteration 3, decreases to around 0.07 at iteration 4, and then remains around 0.06 at iteration 5.
* **Incorrect Flip (Black Dashed Line):** This line begins at approximately 0.06 at iteration 1, decreases to around 0.05 at iteration 2, increases to approximately 0.06 at iteration 3, rises to around 0.065 at iteration 4, and then remains around 0.06 at iteration 5.
### Key Observations
* The Multiple-Choice method shows the most significant decrease in the proportion of flips over the iterations, suggesting improvement in performance.
* The Generation method exhibits a more fluctuating pattern, with a slight overall downward trend.
* The Correct Flip and Incorrect Flip lines remain relatively stable throughout the iterations, with minor fluctuations.
* The initial proportion of flips for Generation and Multiple-Choice is higher than for Correct and Incorrect Flip.
### Interpretation
The data suggests that the Llama-3.1-8B model improves in its ability to answer multiple-choice questions as the iterations progress, as indicated by the decreasing proportion of flips. The Generation method shows some improvement, but it is less pronounced. The relatively stable performance of the Correct and Incorrect Flip methods suggests that the model's ability to identify correct and incorrect answers does not change significantly with each iteration. The difference in initial proportions between the methods could indicate varying levels of difficulty or different evaluation criteria. The chart provides insights into the model's learning process and highlights areas where further improvement may be needed. The model appears to be learning to avoid incorrect answers in the multiple choice setting, but the generation task is more variable.