## Line Chart: Llama-3.1-8B - Proportion of Flips Over Iterations
### Overview
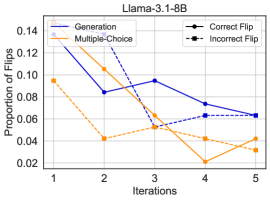
This is a line chart titled "Llama-3.1-8B" that plots the "Proportion of Flips" against "Iterations" (from 1 to 5). It compares four distinct data series, differentiated by line style, color, and marker shape. The chart appears to track the performance or behavior of a model (likely the Llama-3.1-8B language model) across sequential steps or trials.
### Components/Axes
* **Chart Title:** "Llama-3.1-8B" (centered at the top).
* **Y-Axis:**
* **Label:** "Proportion of Flips" (rotated vertically on the left).
* **Scale:** Linear scale from 0.02 to 0.14, with major tick marks at 0.02, 0.04, 0.06, 0.08, 0.10, 0.12, and 0.14.
* **X-Axis:**
* **Label:** "Iterations" (centered at the bottom).
* **Scale:** Discrete integer values from 1 to 5.
* **Legend:** Located in the top-right corner of the plot area. It defines four series:
1. **Generation:** Solid blue line.
2. **Multiple-Choice:** Dashed orange line.
3. **Correct Flip:** Dashed blue line with circular markers (●).
4. **Incorrect Flip:** Dashed orange line with square markers (■).
### Detailed Analysis
**Trend Verification & Data Points (Approximate Values):**
1. **Generation (Solid Blue Line):**
* **Trend:** Starts high, dips, recovers partially, then declines steadily.
* **Points:**
* Iteration 1: ~0.13
* Iteration 2: ~0.09
* Iteration 3: ~0.10
* Iteration 4: ~0.07
* Iteration 5: ~0.06
2. **Multiple-Choice (Dashed Orange Line):**
* **Trend:** Starts moderately high, drops sharply, rises, then fluctuates at a lower level.
* **Points:**
* Iteration 1: ~0.095
* Iteration 2: ~0.04
* Iteration 3: ~0.06
* Iteration 4: ~0.02
* Iteration 5: ~0.04
3. **Correct Flip (Dashed Blue Line with Circles):**
* **Trend:** Shows a consistent upward trend from zero.
* **Points:**
* Iteration 1: 0.00
* Iteration 2: ~0.02
* Iteration 3: ~0.04
* Iteration 4: ~0.06
* Iteration 5: ~0.06
4. **Incorrect Flip (Dashed Orange Line with Squares):**
* **Trend:** Starts at zero, rises to a peak, then declines.
* **Points:**
* Iteration 1: 0.00
* Iteration 2: ~0.02
* Iteration 3: ~0.05 (Peak)
* Iteration 4: ~0.04
* Iteration 5: ~0.03
### Key Observations
* **Convergence at Iteration 5:** The "Generation" and "Correct Flip" series converge at approximately 0.06 by the final iteration.
* **Peak of Incorrect Flips:** The "Incorrect Flip" series reaches its maximum value at Iteration 3, after which it begins to decrease.
* **Initial Disparity:** At Iteration 1, there is a large gap between the "Generation" proportion (~0.13) and the "Multiple-Choice" proportion (~0.095). This gap narrows significantly by Iteration 5.
* **Zero Start for Flip Categories:** Both "Correct Flip" and "Incorrect Flip" begin at 0.00 at Iteration 1, indicating no flips occurred at the start of the measured process.
### Interpretation
The chart likely illustrates the dynamics of a model's output "flips" (changes in response or prediction) during an iterative process, such as reinforcement learning, self-correction, or multi-step reasoning.
* **What the data suggests:** The "Generation" and "Multiple-Choice" lines may represent the overall flip rate for two different prompting or evaluation methods. The "Correct Flip" and "Incorrect Flip" lines break down the *nature* of these flips. The steady rise in "Correct Flip" suggests the model is increasingly making beneficial changes over iterations. The peak and subsequent decline in "Incorrect Flip" around iteration 3 could indicate a phase where the model initially makes more errors while exploring, but then learns to avoid them.
* **Relationship between elements:** The sum of "Correct Flip" and "Incorrect Flip" at any iteration does not equal the "Generation" or "Multiple-Choice" value. This implies that "flips" are a subset of the total changes measured by the other two metrics, or that the metrics are calculated differently. The convergence of "Generation" and "Correct Flip" at the end is notable, suggesting that by iteration 5, most flips in the Generation method are correct.
* **Notable anomaly:** The "Multiple-Choice" flip rate drops to its lowest point (~0.02) at Iteration 4, which is lower than both flip sub-categories at that point. This could indicate a moment of high stability or a specific characteristic of the multiple-choice evaluation at that step.