## Horizontal Bar Chart: Publications by Database
### Overview
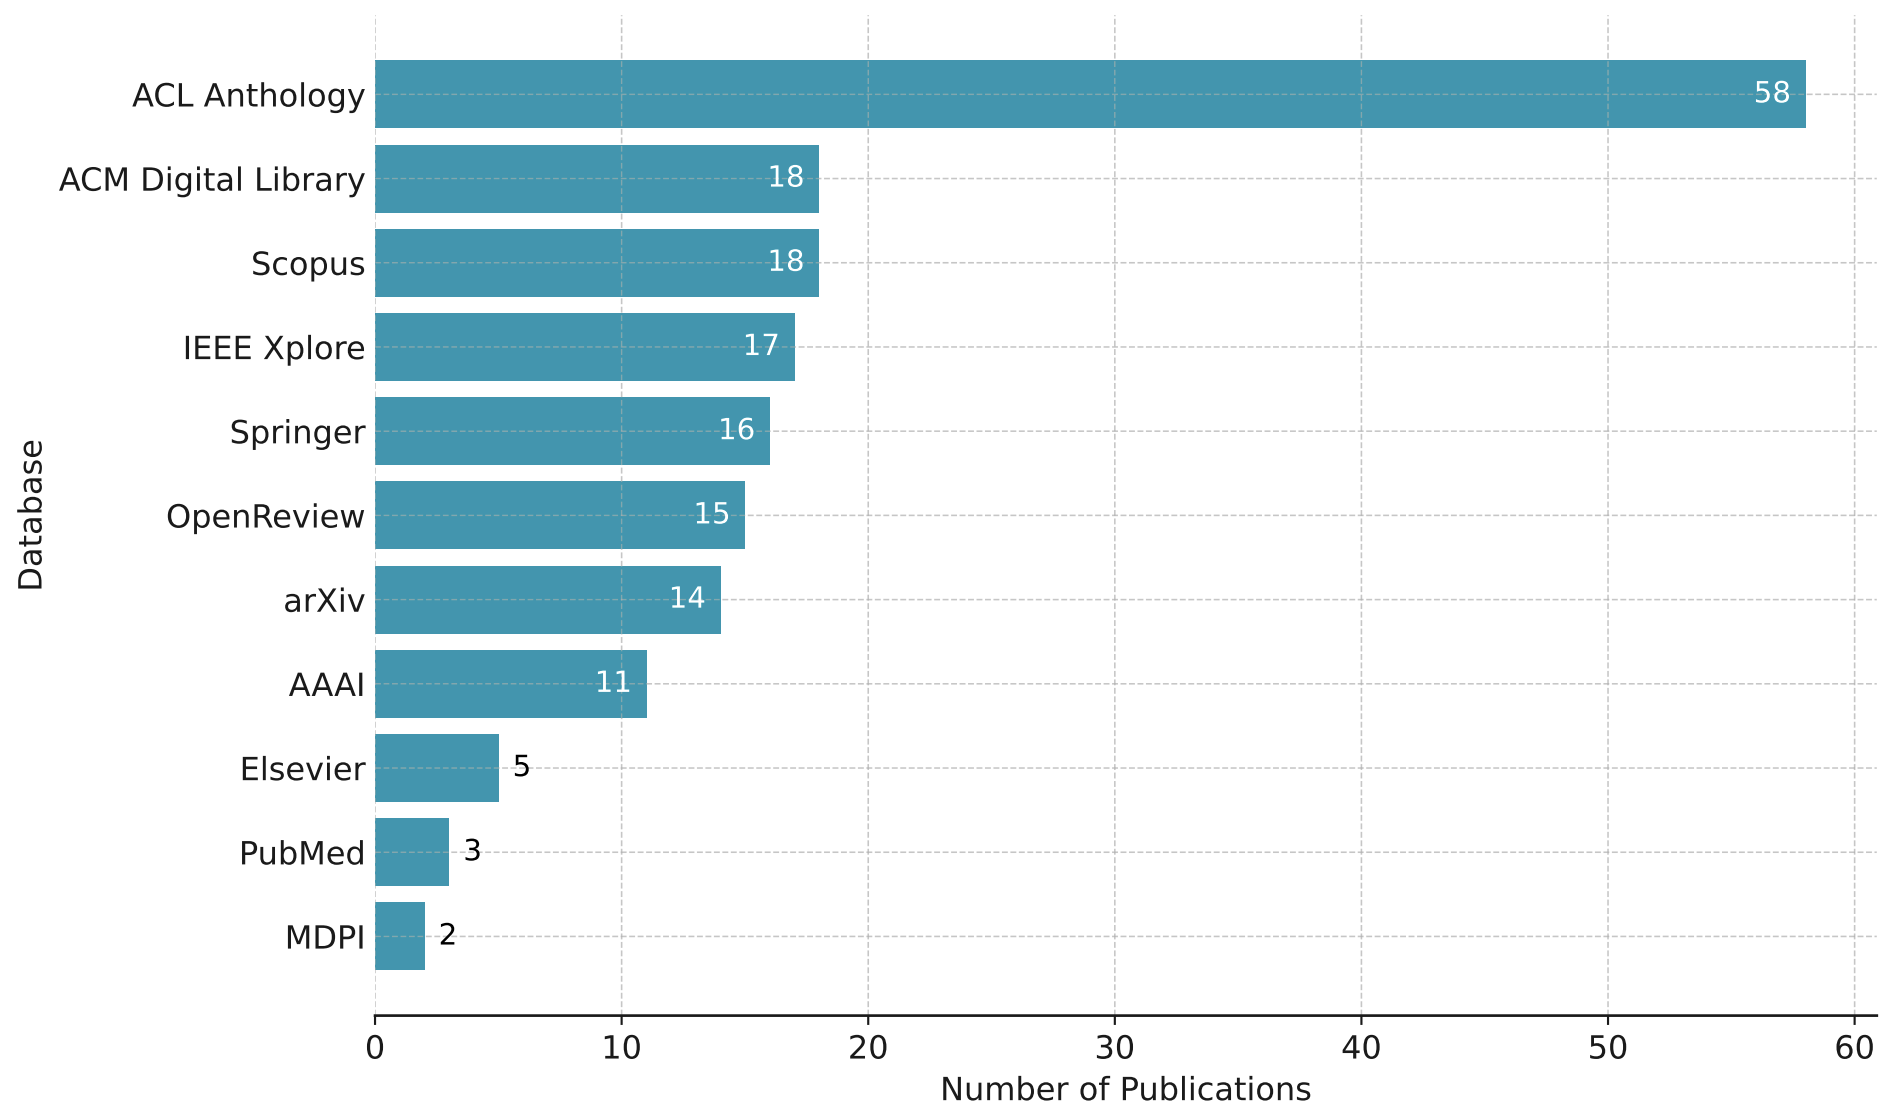
The image is a horizontal bar chart comparing the number of publications across different databases. The chart displays the databases on the vertical axis and the number of publications on the horizontal axis. The bars are teal colored, and the number of publications is displayed at the end of each bar.
### Components/Axes
* **Vertical Axis (Database):** Lists the databases, including ACL Anthology, ACM Digital Library, Scopus, IEEE Xplore, Springer, OpenReview, arXiv, AAAI, Elsevier, PubMed, and MDPI.
* **Horizontal Axis (Number of Publications):** Ranges from 0 to 60, with increments of 10.
* **Bars:** Teal colored bars representing the number of publications for each database.
* **Gridlines:** Light gray dashed gridlines are present to aid in reading the values.
### Detailed Analysis
Here's a breakdown of the number of publications for each database:
* **ACL Anthology:** 58
* **ACM Digital Library:** 18
* **Scopus:** 18
* **IEEE Xplore:** 17
* **Springer:** 16
* **OpenReview:** 15
* **arXiv:** 14
* **AAAI:** 11
* **Elsevier:** 5
* **PubMed:** 3
* **MDPI:** 2
### Key Observations
* ACL Anthology has significantly more publications (58) than any other database.
* ACM Digital Library and Scopus have the same number of publications (18).
* MDPI has the fewest publications (2).
### Interpretation
The chart illustrates the distribution of publications across different databases. ACL Anthology is the most prominent database in this dataset, with a substantially higher number of publications compared to the others. The other databases have relatively similar numbers of publications, with MDPI having the least. This suggests that ACL Anthology is a key resource for the publications being measured.