# Technical Document Extraction: Database Publication Analysis
## Chart Description
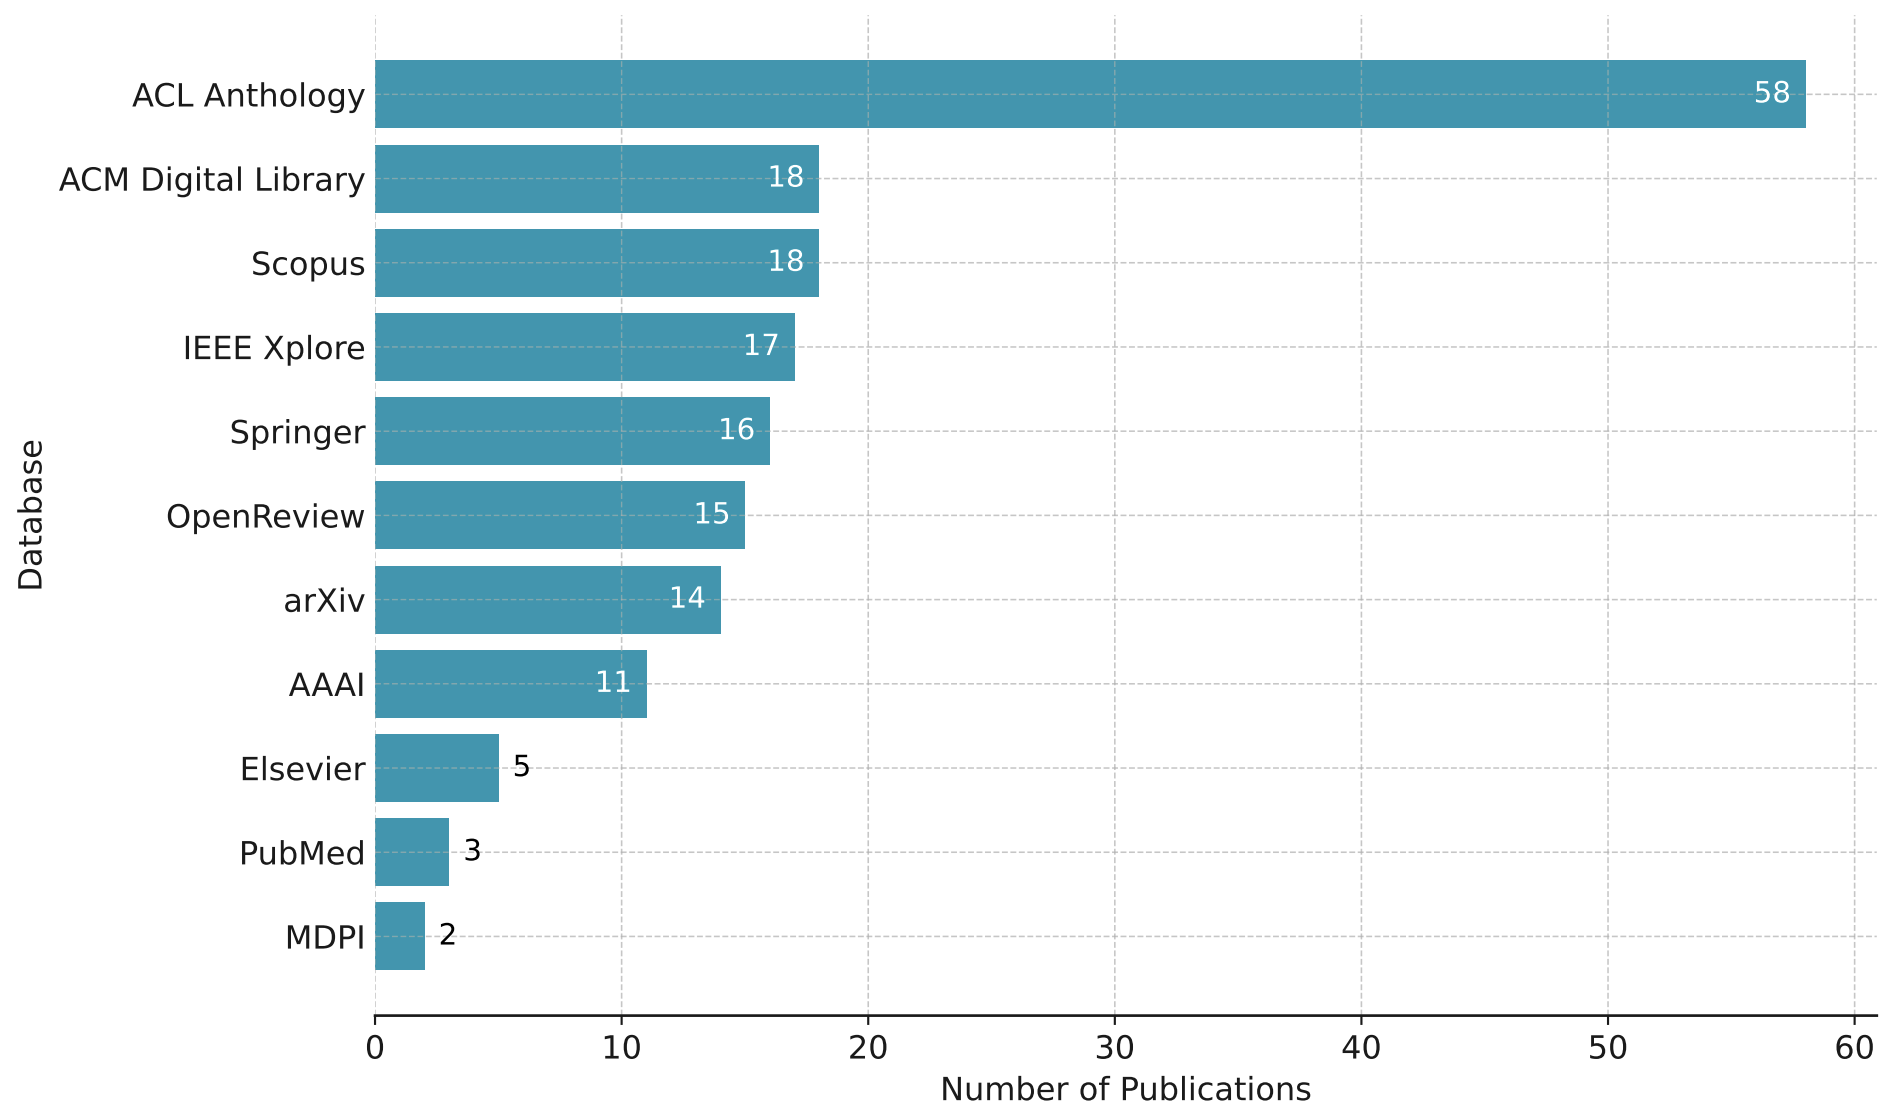
The image is a **horizontal bar chart** visualizing the number of publications across various academic and technical databases. The chart uses **blue-colored bars** to represent quantitative data, with numerical values explicitly labeled on the right side of each bar.
---
### Axis Labels and Markers
- **Y-Axis (Vertical)**: Labeled **"Database"**, listing the names of publication repositories in descending order of publication counts.
- **X-Axis (Horizontal)**: Labeled **"Number of Publications"**, with a linear scale ranging from **0 to 60** in increments of 10.
- **Legend**: **Not present** in the chart.
---
### Data Categories and Values
The chart includes the following databases and their corresponding publication counts:
1. **ACL Anthology**: 58 publications (longest bar, dominant value).
2. **ACM Digital Library**: 18 publications.
3. **Scopus**: 18 publications.
4. **IEEE Xplore**: 17 publications.
5. **Springer**: 16 publications.
6. **OpenReview**: 15 publications.
7. **arXiv**: 14 publications.
8. **AAAI**: 11 publications.
9. **Elsevier**: 5 publications.
10. **PubMed**: 3 publications.
11. **MDPI**: 2 publications (shortest bar).
---
### Key Trends
1. **Dominance of ACL Anthology**: The ACL Anthology database has the highest number of publications (58), significantly outpacing all other databases.
2. **Secondary Cluster**: ACM Digital Library and Scopus are tied at 18 publications, followed closely by IEEE Xplore (17) and Springer (16).
3. **Gradual Decline**: Publication counts decrease progressively from OpenReview (15) to MDPI (2), with no databases exceeding 18 publications after the initial cluster.
4. **Low-Value Outliers**: Elsevier (5), PubMed (3), and MDPI (2) represent the smallest publication counts, with MDPI having the fewest.
---
### Spatial Grounding
- **Bar Placement**: Bars are ordered vertically from top (highest value) to bottom (lowest value), with ACL Anthology at the top and MDPI at the bottom.
- **Numerical Labels**: All values are right-aligned with their respective bars for clarity.
---
### Component Isolation
- **Main Chart**: The horizontal bars and their associated labels dominate the image.
- **Absence of Additional Elements**: No headers, footers, or supplementary annotations are present.
---
### Trend Verification
- **ACL Anthology**: A single outlier with a bar extending to 58, far exceeding all others.
- **Secondary Cluster (18–2 publications)**: Bars decrease in length from ACM Digital Library (18) to MDPI (2), confirming a consistent downward trend.
- **No Anomalies**: All numerical labels align with bar lengths, ensuring data integrity.
---
### Conclusion
The chart highlights the disparity in publication volumes across databases, with ACL Anthology as the clear leader. The remaining databases exhibit a tiered structure, with publication counts clustering around 18–2 publications. This visualization underscores the concentration of academic output in a few key repositories.