## Chart Type: Stacked Bar Chart with Line Overlay
### Overview
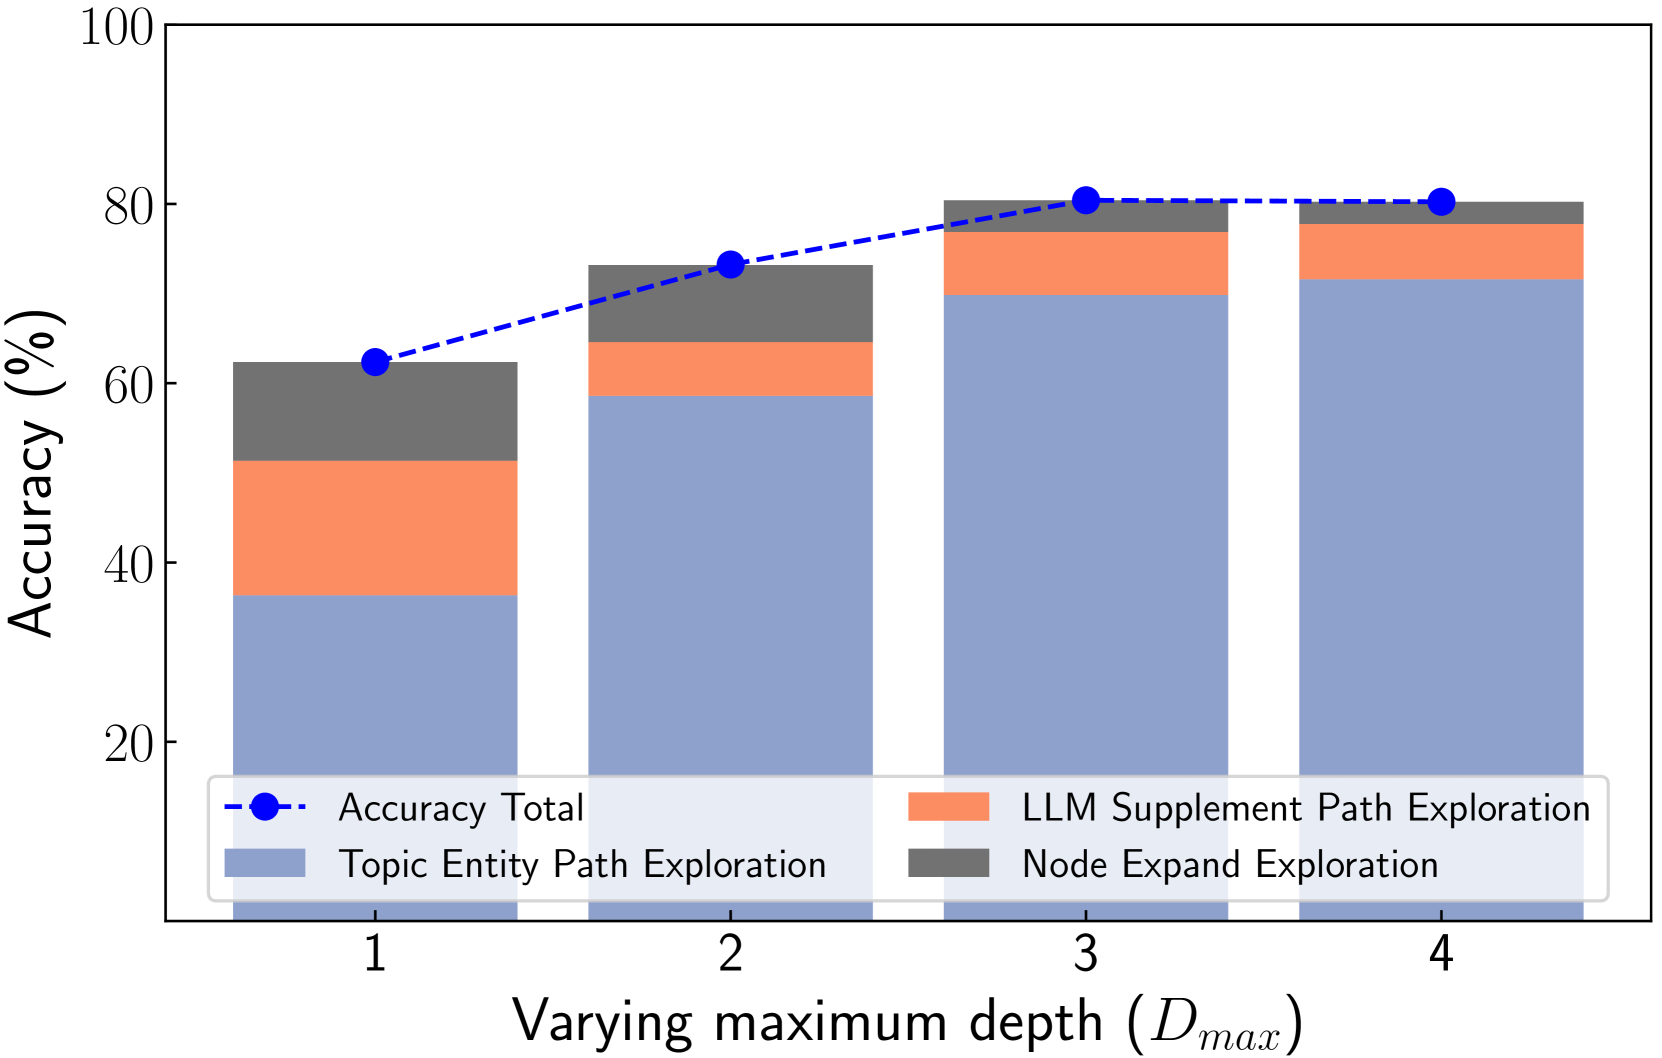
The image is a stacked bar chart showing the breakdown of accuracy contributions from different exploration methods (Topic Entity Path Exploration, LLM Supplement Path Exploration, and Node Expand Exploration) at varying maximum depths. A line graph overlays the bars, representing the total accuracy at each depth.
### Components/Axes
* **X-axis:** "Varying maximum depth ($D_{max}$)" with tick marks at 1, 2, 3, and 4.
* **Y-axis:** "Accuracy (%)" with tick marks at 20, 40, 60, 80, and 100.
* **Legend:** Located at the bottom of the chart.
* Blue dashed line with circles: "Accuracy Total"
* Light Blue: "Topic Entity Path Exploration"
* Coral: "LLM Supplement Path Exploration"
* Gray: "Node Expand Exploration"
### Detailed Analysis
**1. Topic Entity Path Exploration (Light Blue):**
* Depth 1: Approximately 36%
* Depth 2: Approximately 59%
* Depth 3: Approximately 69%
* Depth 4: Approximately 71%
* Trend: The contribution from Topic Entity Path Exploration increases significantly from depth 1 to 2, then increases at a slower rate from depth 2 to 4.
**2. LLM Supplement Path Exploration (Coral):**
* Depth 1: Approximately 15%
* Depth 2: Approximately 6%
* Depth 3: Approximately 1%
* Depth 4: Approximately 1%
* Trend: The contribution from LLM Supplement Path Exploration decreases sharply from depth 1 to 3, then remains relatively constant.
**3. Node Expand Exploration (Gray):**
* Depth 1: Approximately 12%
* Depth 2: Approximately 8%
* Depth 3: Approximately 10%
* Depth 4: Approximately 8%
* Trend: The contribution from Node Expand Exploration is relatively stable across all depths, with a slight fluctuation.
**4. Accuracy Total (Blue Dashed Line with Circles):**
* Depth 1: Approximately 63%
* Depth 2: Approximately 73%
* Depth 3: Approximately 80%
* Depth 4: Approximately 80%
* Trend: The total accuracy increases from depth 1 to 3, then plateaus from depth 3 to 4.
### Key Observations
* The "Topic Entity Path Exploration" contributes the most to the overall accuracy, especially at higher depths.
* The "LLM Supplement Path Exploration" has a significant contribution at depth 1, but its impact diminishes as the depth increases.
* The "Node Expand Exploration" has a relatively consistent contribution across all depths.
* The total accuracy plateaus at a depth of 3, suggesting that increasing the depth beyond this point does not significantly improve performance.
### Interpretation
The data suggests that increasing the maximum depth initially improves the overall accuracy, primarily due to the increasing contribution of "Topic Entity Path Exploration". However, the diminishing returns observed beyond a depth of 3 indicate that other factors may be limiting performance. The "LLM Supplement Path Exploration" seems to be more effective at lower depths, possibly indicating that it is better suited for initial exploration or when the search space is smaller. The relatively stable contribution of "Node Expand Exploration" suggests that it plays a consistent, but not dominant, role in the overall accuracy.