## Diagram: Directed Acyclic Graph
### Overview
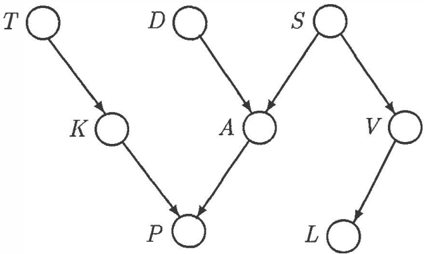
The image depicts a directed acyclic graph (DAG) consisting of nodes labeled with letters and directed edges (arrows) indicating relationships or dependencies between the nodes. The graph shows a flow of influence or causality from top to bottom.
### Components/Axes
* **Nodes:** The nodes are represented by circles, each containing a letter. The nodes are labeled as follows: T, D, S, K, A, V, P, L.
* **Edges:** The edges are represented by arrows, indicating the direction of the relationship between the nodes.
* **Layout:** The nodes are arranged in a layered structure, with some nodes at the top and others at the bottom, suggesting a hierarchical relationship.
### Detailed Analysis
* **Node T:** Located at the top-left, has a directed edge pointing to node K.
* **Node D:** Located at the top-center, has a directed edge pointing to node A.
* **Node S:** Located at the top-right, has directed edges pointing to nodes A and V.
* **Node K:** Located below and to the right of node T, has a directed edge pointing to node P.
* **Node A:** Located below nodes D and S, has a directed edge pointing to node P.
* **Node V:** Located below node S, has a directed edge pointing to node L.
* **Node P:** Located at the bottom-center, is the target of directed edges from nodes K and A.
* **Node L:** Located at the bottom-right, is the target of a directed edge from node V.
### Key Observations
* Nodes T, D, and S are source nodes, having only outgoing edges.
* Nodes P and L are sink nodes, having only incoming edges.
* Nodes K, A, and V are intermediate nodes, having both incoming and outgoing edges.
* Node A receives input from both D and S.
* Node P receives input from both K and A.
### Interpretation
The diagram represents a network of dependencies or relationships between different entities or variables. The arrows indicate the direction of influence or causality. For example, 'T' influences 'K', which in turn influences 'P'. Similarly, 'D' and 'S' both influence 'A', which then influences 'P'. 'S' also influences 'V', which influences 'L'. The graph structure suggests a flow of information or resources from the top nodes to the bottom nodes. The convergence of edges at nodes A and P indicates that these nodes are influenced by multiple factors. This type of diagram is commonly used to model causal relationships, decision-making processes, or information flow in various systems.