## Directed Acyclic Graph (DAG): Dependency Flow Diagram
### Overview
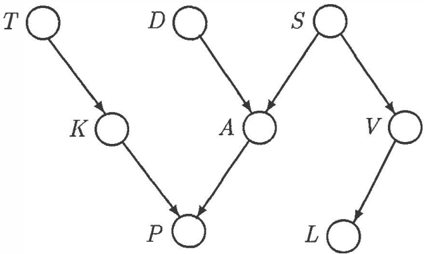
The image displays a directed acyclic graph (DAG) consisting of eight nodes, each represented by a circle containing a single uppercase letter. The nodes are arranged in three hierarchical levels, with directed edges (arrows) indicating a one-way flow or dependency relationship from parent nodes to child nodes. The graph has a clean, technical diagram style with black outlines and arrows on a white background.
### Components/Axes
* **Nodes:** Eight circular nodes, each labeled with a unique letter: `T`, `D`, `S`, `K`, `A`, `V`, `P`, `L`.
* **Edges:** Directed arrows connecting the nodes, indicating the direction of flow or dependency.
* **Spatial Layout:** The nodes are organized into three distinct horizontal rows or levels.
* **Top Row (Level 1):** Contains nodes `T`, `D`, and `S` from left to right.
* **Middle Row (Level 2):** Contains nodes `K`, `A`, and `V` from left to right. `K` is positioned below and between `T` and `D`. `A` is positioned below and between `D` and `S`. `V` is positioned below and to the right of `S`.
* **Bottom Row (Level 3):** Contains nodes `P` and `L`. `P` is positioned below and between `K` and `A`. `L` is positioned below and to the right of `V`.
### Detailed Analysis
**Node Connections and Flow:**
The graph defines the following specific relationships via directed edges:
1. **From Top Row:**
* Node `T` (top-left) has a single outgoing edge pointing to node `K` (middle-left).
* Node `D` (top-center) has a single outgoing edge pointing to node `A` (middle-center).
* Node `S` (top-right) has two outgoing edges: one pointing to node `A` (middle-center) and another pointing to node `V` (middle-right).
2. **From Middle Row:**
* Node `K` (middle-left) has a single outgoing edge pointing to node `P` (bottom-left).
* Node `A` (middle-center) has a single outgoing edge pointing to node `P` (bottom-left).
* Node `V` (middle-right) has a single outgoing edge pointing to node `L` (bottom-right).
**Summary of Paths:**
* Path 1: `T` → `K` → `P`
* Path 2: `D` → `A` → `P`
* Path 3: `S` → `A` → `P`
* Path 4: `S` → `V` → `L`
### Key Observations
* **Convergence Points:** Node `P` is a convergence point, receiving input from two distinct paths (via `K` and `A`). Node `A` is also a convergence point, receiving input from both `D` and `S`.
* **Divergence Point:** Node `S` is a divergence point, influencing two separate downstream branches (`A` and `V`).
* **Terminal Nodes:** Nodes `P` and `L` are terminal nodes (sinks) with no outgoing edges.
* **Source Nodes:** Nodes `T`, `D`, and `S` are source nodes (roots) with no incoming edges.
* **Symmetry:** The graph exhibits partial symmetry. The left branch (`T`→`K`→`P`) and the central branch (`D`→`A`→`P`) both terminate at `P`. The right branch (`S`→`V`→`L`) is separate and terminates at `L`.
### Interpretation
This diagram is a classic representation of a dependency graph, workflow, or causal model. It visually encodes the following information:
* **Sequential Dependencies:** The arrows define a strict order of operations or influence. For example, `P` cannot occur or be computed until both `K` and `A` are complete. `A` depends on both `D` and `S`.
* **Parallel Processes:** The branches originating from `T`, `D`, and `S` can potentially proceed in parallel until they converge. The `S`→`V`→`L` branch operates independently of the processes leading to `P`.
* **System Structure:** The graph suggests a system where multiple initial conditions (`T`, `D`, `S`) feed into intermediate processes (`K`, `A`, `V`), which then produce final outcomes (`P`, `L`). The fact that `P` integrates information from two major branches (`T`-based and `D`/`S`-based) implies it is a primary or composite result, while `L` is a secondary result derived solely from `S`.
* **Potential Applications:** Such a diagram could model a software build process (where letters represent modules), a project management plan (tasks and dependencies), a Bayesian network (probabilistic dependencies), or a data transformation pipeline. The lack of specific labels means the interpretation is abstract, but the structural relationships are explicitly defined.