## Histogram: Response Time Distribution by Entropy Level
### Overview
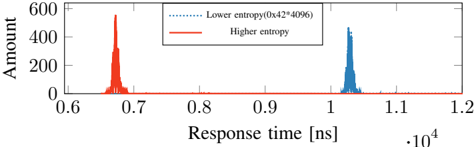
The image displays a histogram comparing the distribution of response times (in nanoseconds) for two different conditions: "Lower entropy" and "Higher entropy." The chart shows two distinct, narrow peaks, indicating that response times are highly consistent within each condition but differ significantly between them.
### Components/Axes
* **Chart Type:** Histogram / Density Plot.
* **X-Axis:**
* **Label:** `Response time [ns]`
* **Scale:** Linear, ranging from approximately 0.6 to 1.2.
* **Multiplier:** A critical notation `·10^4` is present at the bottom-right of the axis, indicating all x-axis values should be multiplied by 10,000. Therefore, the visible range represents 6,000 ns to 12,000 ns.
* **Major Ticks:** 0.6, 0.7, 0.8, 0.9, 1.0, 1.1, 1.2.
* **Y-Axis:**
* **Label:** `Amount`
* **Scale:** Linear, ranging from 0 to 600.
* **Major Ticks:** 0, 200, 400, 600.
* **Legend:**
* **Position:** Top-center of the chart area, slightly overlapping the plot.
* **Entry 1:** `Lower entropy(0x42*4096)` - Represented by a blue dotted line (`...`).
* **Entry 2:** `Higher entropy` - Represented by a solid red line (`—`).
### Detailed Analysis
The chart contains two data series, each forming a single, sharp peak.
1. **Higher Entropy (Solid Red Line):**
* **Trend:** Forms a single, narrow, and tall peak.
* **Peak Location:** The apex is centered at approximately **0.67** on the x-axis scale.
* **Interpreted Value:** 0.67 * 10^4 = **~6,700 ns**.
* **Peak Amplitude:** The peak reaches a height of approximately **550-580** on the "Amount" axis.
* **Distribution Width:** The base of the peak spans roughly from 0.65 to 0.69 (6,500 ns to 6,900 ns), indicating very low variance.
2. **Lower entropy(0x42*4096) (Dotted Blue Line):**
* **Trend:** Forms a single, narrow peak, similar in shape to the red peak but positioned further to the right.
* **Peak Location:** The apex is centered at approximately **1.03** on the x-axis scale.
* **Interpreted Value:** 1.03 * 10^4 = **~10,300 ns**.
* **Peak Amplitude:** The peak reaches a height of approximately **450-480** on the "Amount" axis.
* **Distribution Width:** The base spans roughly from 1.01 to 1.05 (10,100 ns to 10,500 ns), also indicating very low variance.
### Key Observations
* **Clear Bimodality:** The two conditions produce response times that are separated by a significant gap of approximately 3,600 ns (10,300 ns - 6,700 ns). There is no overlap between the two distributions.
* **Consistency:** Both distributions are extremely narrow, suggesting that the response time for each condition is highly predictable and repeatable.
* **Amplitude Difference:** The "Higher entropy" peak is taller than the "Lower entropy" peak, indicating a slightly higher frequency or count of observations at its modal response time.
* **Label Specificity:** The "Lower entropy" condition includes a specific technical parameter `(0x42*4096)`, which likely defines the exact configuration or seed used for that test run.
### Interpretation
This chart demonstrates a strong, causal relationship between the entropy level of a system or process and its performance, measured by response time.
* **Performance Impact:** The data suggests that a **"Higher entropy" condition leads to significantly faster response times** (~6,700 ns) compared to a "Lower entropy" condition (~10,300 ns). The performance difference is substantial, on the order of ~35% faster.
* **System Behavior:** The narrowness of the peaks implies that the system's behavior is deterministic and stable under each tested condition. The response time is not noisy but is tightly bound to the entropy setting.
* **Potential Context:** In computing, entropy often relates to randomness (e.g., in cryptographic operations, memory allocation, or scheduling). This chart could be from a performance analysis of an algorithm or hardware component where higher randomness (entropy) reduces contention, improves cache behavior, or avoids pathological cases, thereby lowering latency. The specific parameter `(0x42*4096)` for the lower entropy case points to a controlled, reproducible experiment.
* **Anomaly/Outlier:** There are no visible outliers or anomalies in the plotted data. The results are clean and show a clear, binary effect.