## Line Chart: Accuracy vs. Thinking Compute
### Overview
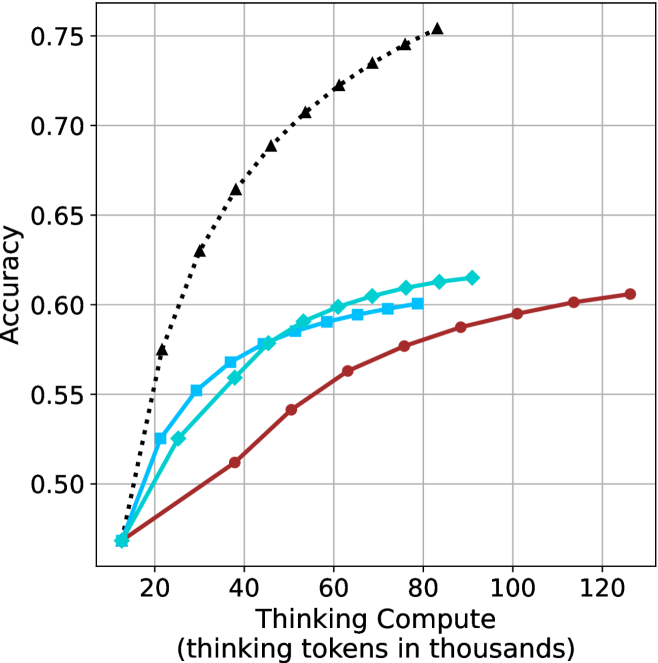
The image is a line chart comparing the performance (Accuracy) of four different methods as a function of computational resources (Thinking Compute). The chart demonstrates how accuracy scales with increased "thinking tokens" for each method, showing distinct scaling laws and efficiency differences.
### Components/Axes
* **Chart Type:** Multi-line chart with markers.
* **X-Axis:**
* **Label:** `Thinking Compute (thinking tokens in thousands)`
* **Scale:** Linear, ranging from 0 to 120.
* **Major Tick Marks:** 0, 20, 40, 60, 80, 100, 120.
* **Y-Axis:**
* **Label:** `Accuracy`
* **Scale:** Linear, ranging from approximately 0.45 to 0.75.
* **Major Tick Marks:** 0.50, 0.55, 0.60, 0.65, 0.70, 0.75.
* **Legend:** Located in the top-left corner of the plot area. It contains four entries:
1. **Chain-of-Thought:** Black dotted line with upward-pointing triangle markers.
2. **Self-Consistency:** Cyan (light blue) solid line with diamond markers.
3. **Self-Consistency + CoT:** Cyan (light blue) solid line with square markers.
4. **Standard:** Red solid line with circle markers.
* **Grid:** A light gray grid is present for both major x and y ticks.
### Detailed Analysis
The chart plots four data series. All series begin at approximately the same point (Thinking Compute ≈ 10k tokens, Accuracy ≈ 0.47) and show increasing accuracy with more compute, but at markedly different rates.
1. **Chain-of-Thought (Black, Dotted, Triangles):**
* **Trend:** Exhibits the steepest, near-logarithmic upward slope. It shows the highest marginal gain in accuracy per additional thinking token.
* **Approximate Data Points:**
* (10, 0.47)
* (20, 0.57)
* (30, 0.63)
* (40, 0.66)
* (50, 0.69)
* (60, 0.71)
* (70, 0.73)
* (80, 0.75)
2. **Self-Consistency (Cyan, Solid, Diamonds):**
* **Trend:** Shows a strong, steady upward slope, but less steep than Chain-of-Thought. It consistently outperforms the Standard method.
* **Approximate Data Points:**
* (10, 0.47)
* (20, 0.53)
* (30, 0.56)
* (40, 0.58)
* (50, 0.59)
* (60, 0.60)
* (70, 0.61)
* (80, 0.615)
3. **Self-Consistency + CoT (Cyan, Solid, Squares):**
* **Trend:** Follows a path nearly identical to the "Self-Consistency" line, with data points often overlapping or lying very close. This suggests combining Self-Consistency with Chain-of-Thought provides minimal additional benefit over Self-Consistency alone in this specific evaluation.
* **Approximate Data Points:**
* (10, 0.47)
* (20, 0.53)
* (30, 0.57)
* (40, 0.58)
* (50, 0.59)
* (60, 0.60)
* (70, 0.605)
4. **Standard (Red, Solid, Circles):**
* **Trend:** Exhibits the shallowest, most linear upward slope. It has the lowest accuracy for any given compute budget beyond the initial point.
* **Approximate Data Points:**
* (10, 0.47)
* (20, 0.49)
* (30, 0.51)
* (40, 0.54)
* (50, 0.56)
* (60, 0.58)
* (70, 0.59)
* (80, 0.60)
* (90, 0.605)
* (100, 0.61)
### Key Observations
* **Performance Hierarchy:** For all compute budgets > 10k tokens, the performance order is clear and consistent: Chain-of-Thought > Self-Consistency ≈ Self-Consistency + CoT > Standard.
* **Diminishing Returns:** All curves show signs of diminishing returns (flattening) as compute increases, but the point of significant flattening occurs much later for Chain-of-Thought.
* **Convergence at Low Compute:** At the lowest compute point (~10k tokens), all methods perform identically (~0.47 accuracy), suggesting the advanced techniques require a minimum compute threshold to show benefit.
* **Method Synergy:** The combination of "Self-Consistency + CoT" does not yield a performance curve above the "Self-Consistency" line, indicating these methods may be addressing similar aspects of the problem or that one subsumes the other's benefits in this context.
### Interpretation
This chart is a powerful visualization of **scaling laws for reasoning methods** in AI. It demonstrates that not all methods scale equally with increased computational resources ("thinking tokens").
* **Chain-of-Thought is Highly Efficient:** The steep slope of the Chain-of-Thought line indicates it is an exceptionally efficient method for converting additional compute into accuracy gains. It suggests that structuring a model's internal reasoning process yields disproportionate benefits.
* **Self-Consistency Provides a Solid Baseline Improvement:** The method offers a reliable, significant boost over the Standard approach but does not scale as aggressively as pure Chain-of-Thought.
* **The "Standard" Approach is Inefficient:** The shallow slope implies that simply allocating more tokens to a standard, unstructured generation process is a less effective strategy for improving accuracy on this task.
* **Practical Implication:** For tasks where accuracy is critical and compute is available, Chain-of-Thought is the most effective strategy shown. The chart provides a quantitative basis for choosing a reasoning method based on a given compute budget. The lack of synergy between Self-Consistency and CoT is a notable finding, suggesting research into their interaction is needed.