## Line Chart: Accuracy vs. Thinking Compute (Tokens in Thousands)
### Overview
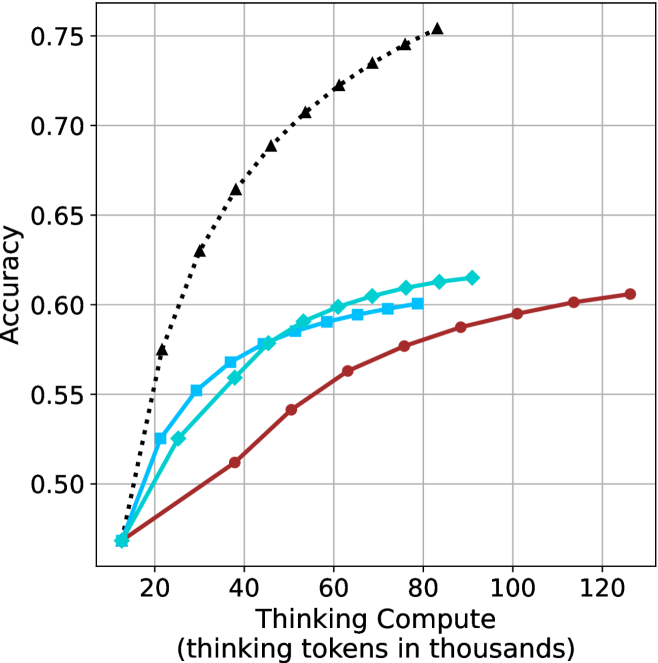
The chart displays three data series representing accuracy metrics across varying levels of "Thinking Compute" (measured in thousands of tokens). The x-axis spans 20 to 120k tokens, while the y-axis ranges from 0.50 to 0.75 accuracy. Three distinct lines (black dotted, blue dashed, red solid) show divergent trends in accuracy improvement.
### Components/Axes
- **X-axis**: "Thinking Compute (thinking tokens in thousands)" (20–120k tokens, increments of 20k)
- **Y-axis**: "Accuracy" (0.50–0.75, increments of 0.05)
- **Legend**: Located in the top-right corner, associating:
- Black dotted line with triangles (▲)
- Blue dashed line with diamonds (◆)
- Red solid line with circles (●)
### Detailed Analysis
1. **Black Dotted Line (▲)**:
- Starts at (20k, 0.50) and rises steadily to (120k, 0.75).
- Intermediate points: (40k, 0.65), (60k, 0.70), (80k, 0.73), (100k, 0.74).
- **Trend**: Linear increase with no plateau.
2. **Blue Dashed Line (◆)**:
- Begins at (20k, 0.48) and plateaus near 0.60 after 80k tokens.
- Intermediate points: (40k, 0.55), (60k, 0.59), (80k, 0.60).
- **Trend**: Accelerated growth until 60k tokens, then flat.
3. **Red Solid Line (●)**:
- Starts at (20k, 0.47) and reaches 0.60 by 120k tokens.
- Intermediate points: (40k, 0.52), (60k, 0.56), (80k, 0.59), (100k, 0.60).
- **Trend**: Gradual, consistent growth with minimal acceleration.
### Key Observations
- The black dotted line (▲) achieves the highest accuracy (0.75) at 120k tokens, outperforming others by ~15%.
- The blue dashed line (◆) plateaus at 0.60 accuracy after 80k tokens, suggesting diminishing returns.
- The red solid line (●) shows the slowest growth but closes the gap to 0.60 accuracy by 120k tokens.
- All lines originate near 0.47–0.50 accuracy at 20k tokens, indicating baseline performance.
### Interpretation
The data suggests a strong correlation between increased thinking compute (tokens) and improved accuracy, with diminishing returns observed in the blue dashed line (◆) after 80k tokens. The black dotted line (▲) demonstrates optimal scalability, achieving near-peak performance (0.75) at 120k tokens. The red solid line (●) indicates a less efficient scaling pattern, requiring more tokens to reach comparable accuracy levels. These trends may reflect differences in model architecture, optimization strategies, or computational efficiency across the three data series.