## 3D Bar Chart: GPU Memory vs. M and N
### Overview
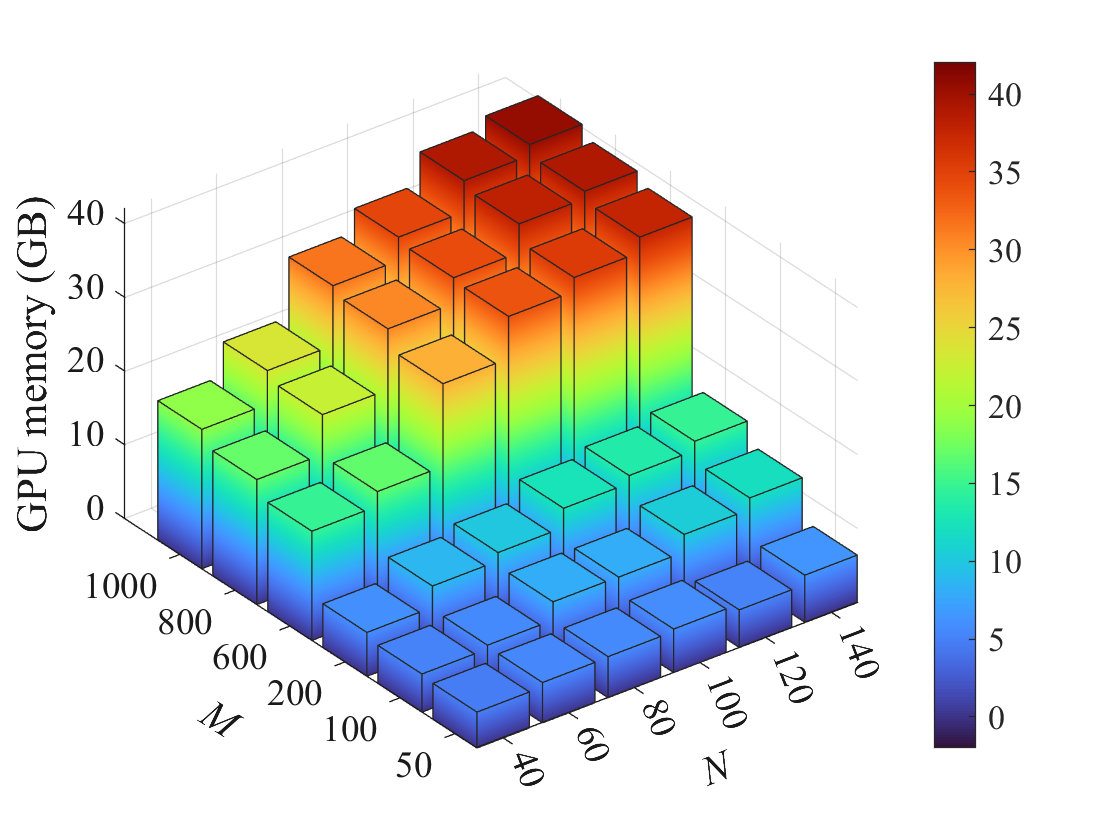
The image is a 3D bar chart visualizing the relationship between GPU memory (in GB) and two variables, M and N. The height and color of each bar represent the GPU memory required for specific combinations of M and N. The color gradient ranges from blue (low memory) to red (high memory).
### Components/Axes
* **Vertical Axis (GPU memory):** Labeled "GPU memory (GB)", with a scale from 0 to 40 GB in increments of 10 GB.
* **Horizontal Axes:**
* **M Axis:** Ranges from 50 to 1000. The specific values shown are 50, 100, 200, 600, 800, and 1000.
* **N Axis:** Ranges from 40 to 140. The specific values shown are 40, 60, 80, 100, 120, and 140.
* **Colorbar:** Located on the right side of the chart, indicating the GPU memory (GB) corresponding to each color. The colorbar ranges from blue (0 GB) to red (40 GB), with intermediate colors representing values in between.
### Detailed Analysis
The chart displays GPU memory usage for different combinations of M and N. Each bar's height corresponds to the GPU memory required, and its color matches the colorbar scale.
Here's a breakdown of the data trends:
* **Trend with M:** As M increases (from 50 to 1000), the GPU memory generally increases for a given value of N.
* **Trend with N:** As N increases (from 40 to 140), the GPU memory generally increases for a given value of M.
* **Highest Memory Usage:** The highest GPU memory usage (close to 40 GB) occurs when both M and N are at their maximum values (M = 1000, N = 140). The bars in the top-right corner of the chart are red, indicating high memory usage.
* **Lowest Memory Usage:** The lowest GPU memory usage (close to 0 GB) occurs when both M and N are at their minimum values (M = 50, N = 40). The bars in the bottom-left corner of the chart are blue, indicating low memory usage.
Specific data points (approximate due to the 3D nature of the chart):
| M | N | GPU Memory (GB) | Color |
| :--- | :--- | :-------------- | :----------- |
| 50 | 40 | ~2 | Dark Blue |
| 1000 | 40 | ~12 | Light Blue |
| 50 | 140 | ~15 | Light Blue |
| 1000 | 140 | ~38-40 | Red |
| 100 | 60 | ~5 | Blue |
| 800 | 120 | ~35 | Orange-Red |
### Key Observations
* GPU memory usage is positively correlated with both M and N.
* The combination of high M and high N results in the highest GPU memory consumption.
* The combination of low M and low N results in the lowest GPU memory consumption.
* The relationship appears roughly linear, but a more precise analysis would require the exact numerical values.
### Interpretation
The chart demonstrates the impact of parameters M and N on GPU memory usage. It suggests that increasing either M or N will lead to higher memory requirements, with the most significant increase occurring when both parameters are maximized. This information is crucial for resource allocation and optimization when working with GPU-intensive applications. The data suggests that if M and N represent some form of data size or complexity, then the GPU memory scales accordingly. The chart provides a visual guide for estimating GPU memory needs based on the values of M and N.