## 3D Bar Chart: GPU Memory Consumption vs. Parameters M and N
### Overview
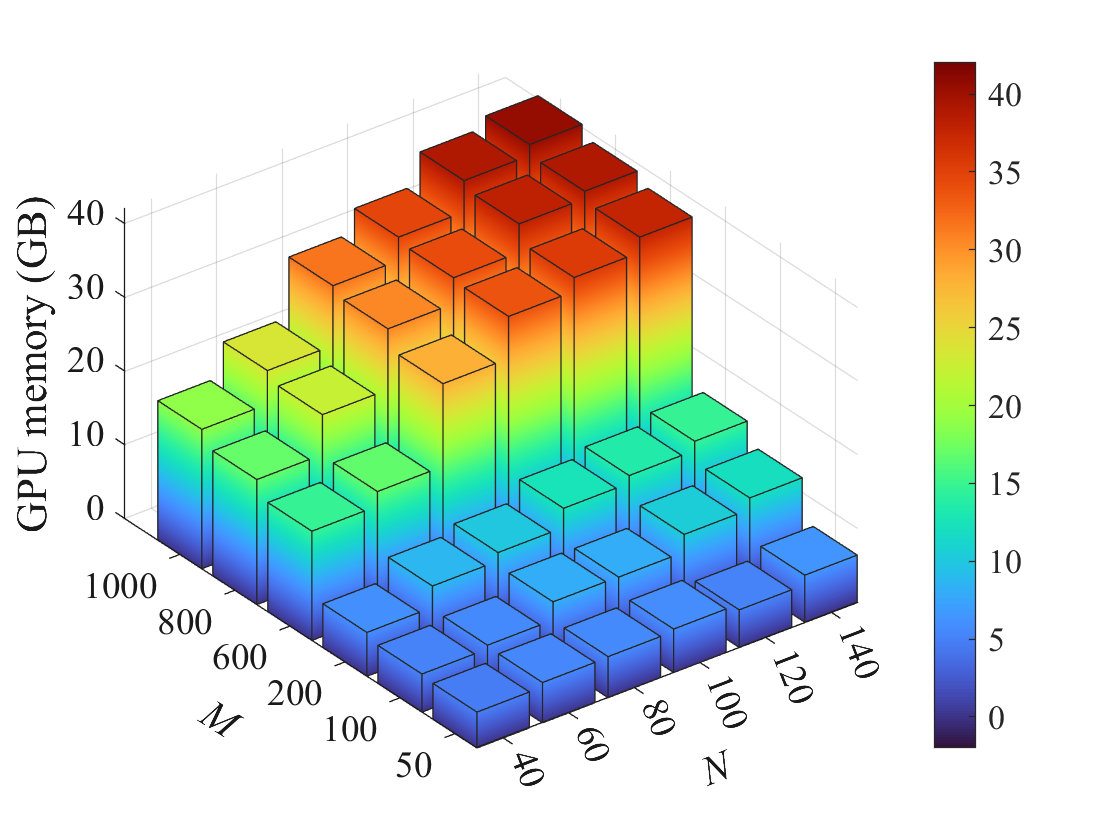
This image is a 3D bar chart visualizing the relationship between two input parameters, labeled **M** and **N**, and the resulting **GPU memory** consumption measured in Gigabytes (GB). The chart demonstrates how memory usage scales as these two parameters increase.
### Components/Axes
* **Vertical Axis (Z-axis):** Labeled "GPU memory (GB)". The scale runs from 0 to 40, with major tick marks at 0, 10, 20, 30, and 40.
* **Left Horizontal Axis (X-axis):** Labeled "M". The discrete categories marked are: 50, 100, 200, 400, 600, 800, 1000.
* **Right Horizontal Axis (Y-axis):** Labeled "N". The discrete categories marked are: 40, 60, 80, 100, 120, 140.
* **Color Bar/Legend:** Positioned on the far right of the image. It is a vertical gradient bar mapping color to GPU memory value. The scale runs from 0 (dark blue) to 40 (dark red), with labeled ticks at 0, 5, 10, 15, 20, 25, 30, 35, and 40. This color scale is applied to the bars themselves, providing a secondary visual cue for memory usage.
### Detailed Analysis
The chart displays a grid of 42 bars (7 values of M × 6 values of N). Each bar's height and color represent the GPU memory for a specific (M, N) pair.
**Trend Verification:**
1. **Trend with M:** For any fixed value of N, moving from the front (M=50) to the back (M=1000) of the chart, the bars consistently increase in height and shift in color from blue/green towards yellow/red. This indicates a strong positive correlation: GPU memory increases as M increases.
2. **Trend with N:** For any fixed value of M, moving from the left (N=40) to the right (N=140) of the chart, the bars also consistently increase in height and shift towards warmer colors. This indicates a strong positive correlation: GPU memory increases as N increases.
3. **Combined Trend:** The highest memory consumption occurs at the combination of the largest M (1000) and largest N (140), located at the back-right corner of the grid. The lowest consumption occurs at the smallest M (50) and smallest N (40), at the front-left corner.
**Approximate Data Points (Estimated from bar height and color):**
* **Low Range (Blue/Cyan Bars):** Found at low M and N values. For example, at (M=50, N=40), memory is approximately 2-5 GB. At (M=100, N=60), it is approximately 5-8 GB.
* **Mid Range (Green/Yellow Bars):** Found at moderate M and N values. For example, at (M=400, N=80), memory is approximately 15-20 GB. At (M=600, N=100), it is approximately 20-25 GB.
* **High Range (Orange/Red Bars):** Found at high M and N values. For example, at (M=800, N=120), memory is approximately 30-35 GB. At the maximum (M=1000, N=140), the bar is dark red, indicating memory usage at or very near the 40 GB upper limit of the scale.
### Key Observations
1. **Smooth, Monotonic Increase:** The progression of bar heights and colors is smooth and monotonic in both dimensions. There are no sudden drops or spikes, suggesting a predictable, likely polynomial or linear, relationship between the parameters and memory usage.
2. **Color as a Redundant Encoding:** The color gradient perfectly aligns with bar height, effectively reinforcing the data magnitude. The hottest (red) colors are exclusively at the peak of the tallest bars.
3. **Grid Layout:** The bars are arranged in a perfect, non-staggered grid, allowing for clear comparison along both the M and N axes.
4. **Scale Saturation:** The highest memory value appears to hit the ceiling of the presented scale (40 GB). It is unknown if memory usage would exceed 40 GB for parameters larger than those shown.
### Interpretation
This chart effectively communicates that GPU memory consumption is a function of two scaling parameters, M and N. The data suggests that both parameters contribute significantly and additively to the memory footprint. The lack of outliers implies a stable and consistent underlying algorithm or model where memory allocation is directly tied to these input sizes.
From a technical perspective, this visualization is crucial for capacity planning. It allows a user to estimate the required GPU memory for a given workload defined by M and N. For instance, if a task requires M=600 and N=100, one can quickly see from the chart (yellow-green bar) that a GPU with at least 25 GB of memory would be necessary. The chart implies that memory scales more steeply with M than with N, as the gradient of increase appears sharper when moving along the M-axis compared to the N-axis. This could indicate that M represents a dimension with a higher memory complexity (e.g., batch size or sequence length) than N (e.g., model width or feature count).