## 3D Bar Chart: GPU Memory Allocation by M and N Parameters
### Overview
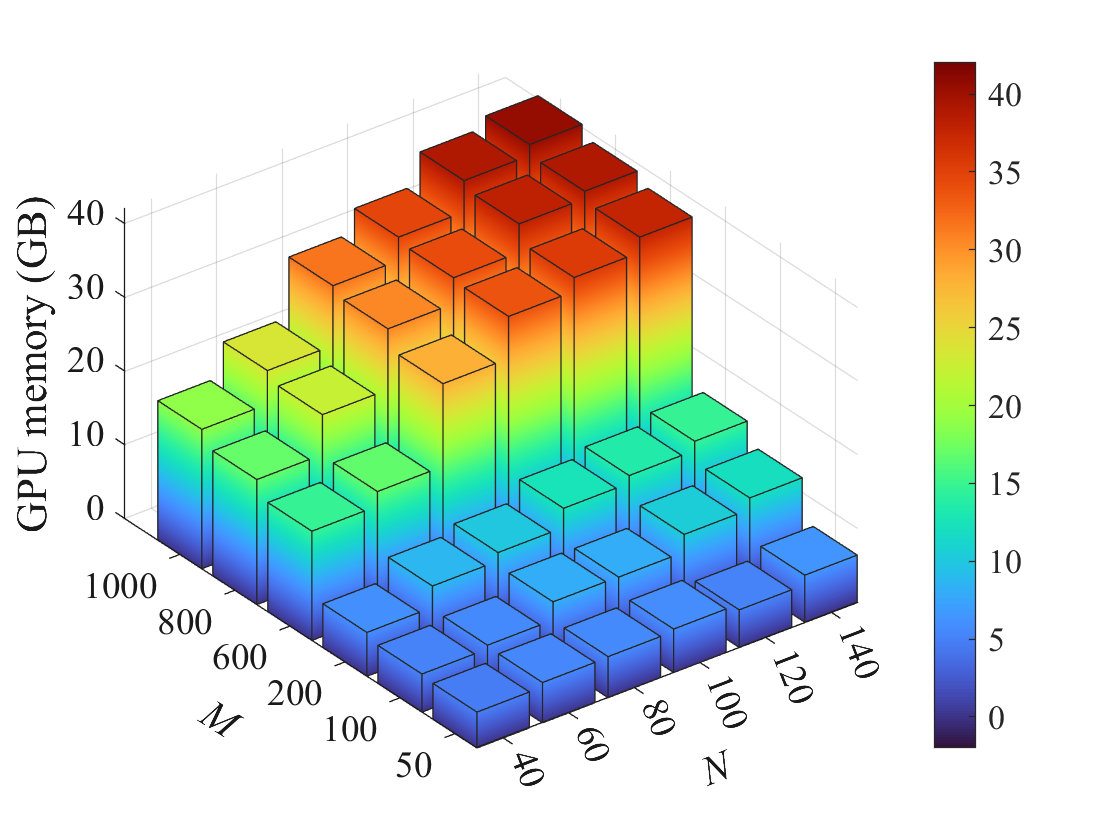
The image depicts a 3D bar chart visualizing GPU memory allocation (in GB) as a function of two parameters: **M** (y-axis) and **N** (x-axis). The chart uses a color gradient (blue to red) to represent memory values, with a legend on the right. The z-axis represents GPU memory, ranging from 0 to 40 GB.
---
### Components/Axes
- **X-axis (N)**: Labeled "N" with values from **40 to 140** in increments of 20.
- **Y-axis (M)**: Labeled "M" with values from **50 to 1000** in increments of 200.
- **Z-axis**: Labeled "GPU memory (GB)" with values from **0 to 40** in increments of 10.
- **Legend**: Positioned on the right, mapping colors to memory values:
- **Blue**: 0–5 GB
- **Cyan**: 5–10 GB
- **Green**: 10–15 GB
- **Yellow**: 15–20 GB
- **Orange**: 20–25 GB
- **Red**: 25–40 GB
---
### Detailed Analysis
1. **Bar Structure**:
- Bars are arranged in a grid corresponding to **M** (y-axis) and **N** (x-axis).
- Height of each bar represents GPU memory, with color intensity matching the legend.
2. **Key Data Points**:
- **Highest Memory (Red)**:
- Located at **M = 1000** and **N = 140**.
- Approximate value: **40 GB** (top of the red gradient).
- **Lowest Memory (Blue)**:
- Located at **M = 50** and **N = 40**.
- Approximate value: **0–2 GB** (base of the blue gradient).
- **Intermediate Values**:
- At **M = 500, N = 100**: Green-yellow gradient (~15–20 GB).
- At **M = 200, N = 80**: Cyan (~5–10 GB).
3. **Trends**:
- **Positive Correlation**: GPU memory increases monotonically with both **M** and **N**.
- **Steepest Growth**: Observed in the upper-right quadrant (high M and N values).
- **Color Gradient Consistency**: Colors align precisely with the legend (e.g., red bars only appear at the highest memory values).
---
### Key Observations
- **Outlier**: No anomalies detected; all bars follow the expected gradient.
- **Dominant Pattern**: Memory usage scales linearly with **M** and **N**, suggesting a direct dependency.
- **Color Accuracy**: All bars match the legend’s color-to-value mapping without deviation.
---
### Interpretation
The chart demonstrates that GPU memory allocation is **directly proportional to both M and N parameters**. This implies:
1. **Resource Planning**: Higher M and N values require significantly more GPU memory, critical for system design or optimization.
2. **Efficiency Insight**: Lower M and N values (e.g., M=50, N=40) consume minimal memory, indicating potential for lightweight configurations.
3. **Scalability**: The linear relationship suggests predictable scaling for applications dependent on these parameters.
The visualization effectively communicates how memory demands grow with increasing computational parameters, aiding in capacity planning or performance analysis.