# Technical Document Extraction: Scatter Plot Analysis
## 1. **Axis Labels and Titles**
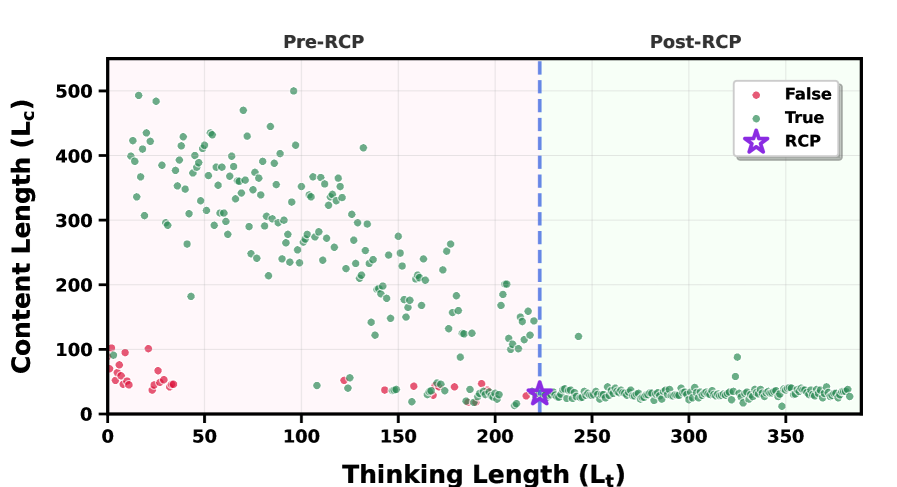
- **X-Axis**: "Thinking Length (Lt)"
- Range: 0 to 350 (linear scale)
- **Y-Axis**: "Content Length (Lc)"
- Range: 0 to 500 (linear scale)
## 2. **Legend and Data Series**
- **Legend Location**: Top-right corner
- **Red Dots**: Labeled "False"
- **Green Dots**: Labeled "True"
- **Purple Star**: Labeled "RCP"
## 3. **Key Visual Components**
- **Vertical Dashed Line**:
- Position: `Lt = 200`
- Label: "Pre-RCP" (left) / "Post-RCP" (right)
- **Data Point Distribution**:
- **Pre-RCP Region (Lt < 200)**:
- **Red Points ("False")**: Clustered near `Lt = 0–50`, `Lc = 0–100`
- **Green Points ("True")**: Scattered across `Lt = 50–200`, `Lc = 100–500`
- **Post-RCP Region (Lt ≥ 200)**:
- **Green Points ("True")**: Dominant, concentrated at `Lt = 200–350`, `Lc = 0–100`
- **Purple Star ("RCP")**: Single point at `(Lt = 210, Lc = 20)`
## 4. **Trend Verification**
- **Pre-RCP Region**:
- Red points ("False") show a **concentration in low-Lt, low-Lc** values.
- Green points ("True") exhibit a **downward trend** in `Lc` as `Lt` increases.
- **Post-RCP Region**:
- Green points ("True") form a **horizontal band** at `Lc = 0–100` across `Lt = 200–350`.
- The RCP point ("Purple Star") is an **outlier** in the Post-RCP region, positioned at `(210, 20)`.
## 5. **Spatial Grounding**
- **Legend**: Top-right corner (no overlap with data points).
- **RCP Star**: Positioned at `(210, 20)`, just right of the vertical line (`Lt = 200`).
- **Color Consistency**:
- Red = False (confirmed in Pre-RCP cluster).
- Green = True (confirmed in both regions).
- Purple = RCP (single point, no overlap with other series).
## 6. **Component Isolation**
- **Header**: Title "Pre-RCP" (left) / "Post-RCP" (right) above the plot.
- **Main Chart**: Scatter plot with two regions divided by `Lt = 200`.
- **Footer**: No additional text or labels.
## 7. **Data Table Reconstruction**
| Region | Data Series | Lt Range | Lc Range | Notes |
|------------|-------------|----------------|----------------|--------------------------------|
| Pre-RCP | False | 0–50 | 0–100 | Clustered in lower-left |
| Pre-RCP | True | 50–200 | 100–500 | Downward trend in Lc |
| Post-RCP | True | 200–350 | 0–100 | Horizontal band at low Lc |
| Post-RCP | RCP | 210 | 20 | Single outlier |
## 8. **Language and Transcription**
- **Language**: English (no non-English text present).
- **Transcribed Text**:
- Axis labels: "Thinking Length (Lt)", "Content Length (Lc)"
- Legend labels: "False", "True", "RCP"
- Region labels: "Pre-RCP", "Post-RCP"
## 9. **Critical Observations**
- The vertical line at `Lt = 200` demarcates a clear boundary between Pre-RCP and Post-RCP regions.
- The RCP point (`210, 20`) is the only non-green data point in the Post-RCP region, suggesting a potential anomaly or special case.
- Green points ("True") dominate both regions but show distinct spatial patterns:
- Pre-RCP: Scattered, decreasing `Lc` with increasing `Lt`.
- Post-RCP: Concentrated at low `Lc` values.
## 10. **Conclusion**
The plot illustrates a shift in data distribution after the RCP intervention, with most "True" values clustering at low `Lc` in the Post-RCP region. The RCP point itself is an outlier, warranting further investigation.