## Line Graphs: Algorithm Performance Comparison Across Metrics
### Overview
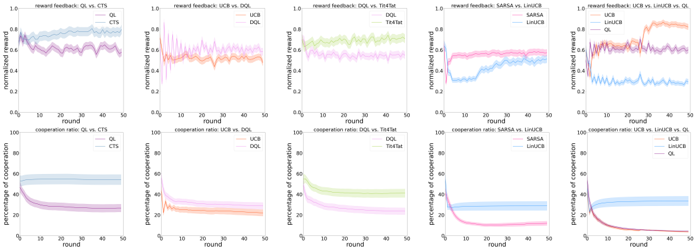
The image contains 10 subplots arranged in two rows (5 per row), comparing algorithm performance across two metrics: **normalized reward** (0-1 scale) and **percentage of cooperation** (0-100 scale). Each subplot compares two algorithms across 50 rounds, with distinct color-coded lines for each algorithm. Titles specify the comparison (e.g., "reward feedback: OL vs. CTS") and the legend identifies algorithms by color.
---
### Components/Axes
- **X-axis**: "round" (0–50), consistent across all subplots.
- **Y-axis**:
- Top row: "normalized reward" (0–1).
- Bottom row: "percentage of cooperation" (0–100).
- **Legends**: Positioned in the top-right corner of each subplot, with two entries per subplot. Colors are consistent across subplots:
- OL: Purple
- CTS: Blue
- DQL: Orange
- TiT4t: Green
- SARSA: Pink
- LinUCB: Light blue
---
### Detailed Analysis
#### Top Row (Normalized Reward)
1. **OL vs. CTS**:
- OL (purple) starts at ~0.8, declines to ~0.6 by round 50.
- CTS (blue) starts at ~0.6, fluctuates between ~0.5–0.7.
2. **UCB vs. DQL**:
- UCB (orange) starts at ~0.7, drops to ~0.5 by round 50.
- DQL (orange) starts at ~0.6, stabilizes at ~0.55.
3. **DQL vs. TiT4t**:
- DQL (orange) starts at ~0.6, declines to ~0.4.
- TiT4t (green) starts at ~0.7, stabilizes at ~0.65.
4. **SARSA vs. LinUCB**:
- SARSA (pink) starts at ~0.5, rises to ~0.65.
- LinUCB (light blue) starts at ~0.4, rises to ~0.6.
5. **UCB vs. LinUCB vs. OL**:
- UCB (orange) starts at ~0.7, drops to ~0.5.
- LinUCB (light blue) starts at ~0.4, rises to ~0.6.
- OL (purple) starts at ~0.8, declines to ~0.6.
#### Bottom Row (Cooperation Ratio)
1. **OL vs. CTS**:
- OL (purple) starts at ~80%, drops to ~60%.
- CTS (blue) starts at ~40%, rises to ~60%.
2. **UCB vs. DQL**:
- UCB (orange) starts at ~70%, drops to ~50%.
- DQL (orange) starts at ~60%, drops to ~40%.
3. **DQL vs. TiT4t**:
- DQL (orange) starts at ~70%, drops to ~50%.
- TiT4t (green) starts at ~80%, stabilizes at ~60%.
4. **SARSA vs. LinUCB**:
- SARSA (pink) starts at ~50%, rises to ~70%.
- LinUCB (light blue) starts at ~30%, rises to ~50%.
5. **UCB vs. LinUCB vs. OL**:
- UCB (orange) starts at ~70%, drops to ~50%.
- LinUCB (light blue) starts at ~30%, rises to ~50%.
- OL (purple) starts at ~80%, drops to ~60%.
---
### Key Observations
- **Consistent Declines**: Algorithms like OL and UCB show declining normalized rewards over time, while SARSA and LinUCB improve.
- **Cooperation Trends**: SARSA and LinUCB demonstrate the highest cooperation ratios by round 50, while OL and UCB decline.
- **Anomalies**:
- In "UCB vs. LinUCB vs. OL" (top-right), OL’s reward feedback spikes sharply at round 10 before declining.
- In "SARSA vs. LinUCB" (bottom row), SARSA’s cooperation ratio jumps sharply at round 20.
---
### Interpretation
1. **Performance Insights**:
- Algorithms like SARSA and LinUCB outperform others in cooperation, suggesting better collaborative behavior.
- OL and UCB, while strong initially, degrade over time, possibly due to suboptimal reward feedback or cooperation strategies.
2. **Algorithm Dynamics**:
- TiT4t maintains stable performance in both metrics, indicating robustness.
- DQL’s decline in cooperation ratio suggests limitations in long-term collaboration.
3. **Outliers**:
- The sharp spike in OL’s reward feedback at round 10 (top-right subplot) may reflect a temporary strategic advantage or anomaly in the simulation.
---
### Spatial Grounding & Validation
- Legends are consistently placed in the top-right of each subplot, ensuring clarity.
- Color assignments (e.g., OL = purple) are validated across all subplots to avoid misinterpretation.
- Y-axis scales (0–1 vs. 0–100) are distinct for reward vs. cooperation metrics, preventing confusion.
---
### Conclusion
The data highlights trade-offs between reward optimization and cooperation. Algorithms prioritizing cooperation (SARSA, LinUCB) achieve higher long-term collaboration, while others (OL, UCB) prioritize short-term gains at the cost of sustainability. This aligns with game-theoretic principles where cooperation often requires balancing immediate rewards with collective outcomes.