\n
## Chart: Learning Curves for Multi-Agent Reinforcement Learning Algorithms
### Overview
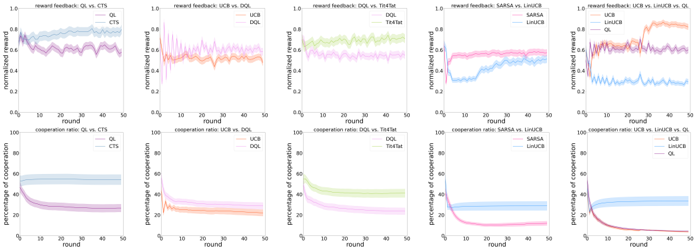
The image presents a series of six 2x2 grids of line charts, comparing the performance of different multi-agent reinforcement learning algorithms. Each grid compares two algorithms across two metrics: normalized reward and percentage of cooperation, plotted against the round number (presumably representing training iterations). The algorithms being compared are QLearning vs. CTS, UCB vs. DQL, DQL vs. ToolFlat, SARSA vs. LinUCB, and LinUCB vs. UCB.
### Components/Axes
Each chart shares the following components:
* **X-axis:** "round" - ranging from 0 to 50.
* **Y-axis (Top Chart):** "normalized reward" - ranging from 0.6 to 1.0.
* **Y-axis (Bottom Chart):** "percentage of cooperation" - ranging from 0 to 100.
* **Legends:** Each chart has a legend indicating the algorithms being compared, with each algorithm represented by a distinct color.
The algorithms used are:
* CTS
* QL
* UCB
* DQL
* ToolFlat
* SARSA
* LinUCB
### Detailed Analysis or Content Details
**Grid 1: QLearning vs. CTS**
* **Normalized Reward (Top):**
* CTS (Blue): Starts around 0.75, fluctuates between 0.7 and 0.85, with a slight upward trend. Approximately 0.78 at round 50.
* QL (Purple): Starts around 0.75, decreases rapidly to around 0.65, then stabilizes around 0.68. Approximately 0.67 at round 50.
* **Percentage of Cooperation (Bottom):**
* CTS (Blue): Starts around 80, drops sharply to around 10-20, and stabilizes. Approximately 15 at round 50.
* QL (Purple): Starts around 80, drops very sharply to near 0, and remains close to 0. Approximately 0 at round 50.
**Grid 2: UCB vs. DQL**
* **Normalized Reward (Top):**
* UCB (Orange): Starts around 0.8, fluctuates between 0.75 and 0.9, with a slight upward trend. Approximately 0.85 at round 50.
* DQL (Light Orange): Starts around 0.75, increases to around 0.85, then fluctuates. Approximately 0.83 at round 50.
* **Percentage of Cooperation (Bottom):**
* UCB (Orange): Starts around 80, drops sharply to around 20-30, and stabilizes. Approximately 25 at round 50.
* DQL (Light Orange): Starts around 80, drops very sharply to near 0, and remains close to 0. Approximately 0 at round 50.
**Grid 3: DQL vs. ToolFlat**
* **Normalized Reward (Top):**
* DQL (Green): Starts around 0.7, increases steadily to around 0.9. Approximately 0.9 at round 50.
* ToolFlat (Light Green): Starts around 0.7, increases steadily to around 0.85. Approximately 0.85 at round 50.
* **Percentage of Cooperation (Bottom):**
* DQL (Green): Starts around 80, drops very sharply to near 0, and remains close to 0. Approximately 0 at round 50.
* ToolFlat (Light Green): Starts around 80, drops sharply to around 20-30, and stabilizes. Approximately 25 at round 50.
**Grid 4: SARSA vs. LinUCB**
* **Normalized Reward (Top):**
* SARSA (Pink): Starts around 0.7, drops sharply to around 0.6, then remains relatively stable. Approximately 0.6 at round 50.
* LinUCB (Light Pink): Starts around 0.7, increases to around 0.9, then fluctuates. Approximately 0.85 at round 50.
* **Percentage of Cooperation (Bottom):**
* SARSA (Pink): Starts around 80, drops very sharply to near 0, and remains close to 0. Approximately 0 at round 50.
* LinUCB (Light Pink): Starts around 80, drops sharply to around 20-30, and stabilizes. Approximately 25 at round 50.
**Grid 5: LinUCB vs. UCB**
* **Normalized Reward (Top):**
* LinUCB (Red): Starts around 0.7, increases to around 0.9, then fluctuates. Approximately 0.85 at round 50.
* UCB (Light Red): Starts around 0.7, fluctuates between 0.7 and 0.85. Approximately 0.78 at round 50.
* **Percentage of Cooperation (Bottom):**
* LinUCB (Red): Starts around 80, drops sharply to around 20-30, and stabilizes. Approximately 25 at round 50.
* UCB (Light Red): Starts around 80, drops sharply to around 30-40, and stabilizes. Approximately 35 at round 50.
### Key Observations
* Algorithms like DQL, ToolFlat, and LinUCB generally achieve higher normalized rewards compared to their counterparts (QL, UCB, SARSA).
* The percentage of cooperation consistently decreases for all algorithms, often converging to very low values (near 0).
* There's a clear trade-off between reward and cooperation. Algorithms with higher rewards tend to have lower cooperation rates.
* The initial drop in cooperation is particularly steep for algorithms like QL, DQL, and SARSA.
### Interpretation
The data suggests that maximizing normalized reward in these multi-agent scenarios often comes at the cost of cooperation. Algorithms that prioritize individual reward (like DQL and LinUCB) achieve higher rewards but exhibit significantly lower cooperation rates. Conversely, algorithms like CTS and UCB maintain some level of cooperation, but their rewards are comparatively lower.
The rapid decline in cooperation across all algorithms indicates a potential challenge in designing multi-agent systems that can effectively balance individual incentives with collective goals. The differences in the learning curves highlight the impact of different learning algorithms on the emergent behavior of the agents. The fact that the percentage of cooperation drops to near zero for some algorithms suggests that these agents may be engaging in competitive or even exploitative behavior.
The comparison between LinUCB and UCB is particularly interesting, as they both utilize upper confidence bound exploration, but LinUCB consistently outperforms UCB in terms of normalized reward while maintaining a slightly higher cooperation rate. This suggests that the linear function approximation used in LinUCB may be more effective in capturing the dynamics of the environment.