TECHNICAL ASSET FINGERPRINT
a544e61461bb1f623afdcfae
Click to view fullscreen
Press ESC or click to close
FOUND IN PAPERS
EXPERT: healer-alpha-free VERSION 1
RUNTIME: free/openrouter/healer-alpha
INTEL_VERIFIED
## [Multi-Panel Line Chart]: Comparative Performance of Reinforcement Learning Algorithms
### Overview
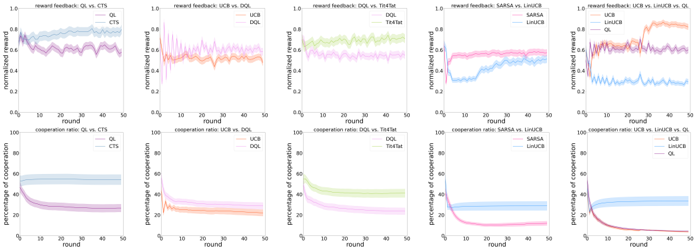
The image displays a 2x5 grid of ten line charts, comparing the performance of various reinforcement learning (RL) algorithms over 50 rounds. The top row (5 charts) measures "normalized reward," while the bottom row (5 charts) measures "percentage of cooperation." Each chart compares two or three specific algorithms, with shaded regions indicating confidence intervals or variance around the mean performance line.
### Components/Axes
* **Chart Type:** Multi-panel line charts with shaded confidence bands.
* **X-Axis (All Charts):** Labeled "round," with a linear scale from 0 to 50, marked at intervals of 10.
* **Y-Axis (Top Row):** Labeled "normalized reward," with a linear scale from 0.0 to 1.0, marked at intervals of 0.2.
* **Y-Axis (Bottom Row):** Labeled "percentage of cooperation," with a linear scale from 0 to 100, marked at intervals of 20.
* **Legends:** Each subplot contains a legend, typically positioned in the top-right or top-left corner of the plot area, identifying the algorithms by color and line style.
* **Subplot Titles:** Each chart has a title at the top indicating the metric and the algorithms being compared (e.g., "reward feedback: QL vs. CTS").
### Detailed Analysis
**Top Row: Normalized Reward Feedback**
1. **Chart 1 (Top-Left): "reward feedback: QL vs. CTS"**
* **Legend:** QL (blue line), CTS (purple line). Legend is top-right.
* **Trend & Data:** The QL line starts near 0.6, shows a general upward trend with high variance, and ends near 0.8. The CTS line starts lower (~0.5), fluctuates, and ends near 0.7. Both show significant variance (wide shaded bands).
2. **Chart 2: "reward feedback: DQL vs. DQL-TFT"**
* **Legend:** DQL (orange line), DQL-TFT (pink line). Legend is top-right.
* **Trend & Data:** The DQL line starts around 0.5, fluctuates with a slight downward trend, ending near 0.4. The DQL-TFT line starts higher (~0.7), declines steadily, and ends near 0.5. DQL-TFT maintains a higher reward than DQL throughout.
3. **Chart 3: "reward feedback: DQL vs. TFTbot"**
* **Legend:** DQL (green line), TFTbot (light green line). Legend is top-right.
* **Trend & Data:** The DQL line starts near 0.6, fluctuates, and ends near 0.7. The TFTbot line starts higher (~0.8), remains relatively flat with minor fluctuations, and ends near 0.8. TFTbot consistently outperforms DQL.
4. **Chart 4: "reward feedback: SARSA vs. LHACB"**
* **Legend:** SARSA (blue line), LHACB (pink line). Legend is top-right.
* **Trend & Data:** The SARSA line starts near 0.4, rises to about 0.6 by round 10, then plateaus. The LHACB line starts higher (~0.7), dips slightly, then rises to end near 0.8. LHACB maintains a clear advantage.
5. **Chart 5 (Top-Right): "reward feedback: LHACB vs. LHACB-TFT vs. DQL"**
* **Legend:** LHACB (pink line), LHACB-TFT (purple line), DQL (blue line). Legend is top-right.
* **Trend & Data:** The LHACB line starts near 0.7 and ends near 0.8. The LHACB-TFT line starts near 0.6, rises sharply to ~0.9 by round 20, then fluctuates at a high level. The DQL line starts near 0.5, fluctuates, and ends near 0.6. LHACB-TFT achieves the highest reward.
**Bottom Row: Percentage of Cooperation**
1. **Chart 6 (Bottom-Left): "cooperation ratio: QL vs. CTS"**
* **Legend:** QL (blue line), CTS (purple line). Legend is top-right.
* **Trend & Data:** The QL line starts near 60%, declines gradually, and ends near 40%. The CTS line starts near 40%, declines more steeply, and ends near 20%. Both show decreasing cooperation, with CTS decreasing faster.
2. **Chart 7: "cooperation ratio: DQL vs. DQL-TFT"**
* **Legend:** DQL (orange line), DQL-TFT (pink line). Legend is top-right.
* **Trend & Data:** The DQL line starts near 40%, declines steadily, and ends near 20%. The DQL-TFT line starts near 60%, declines sharply in the first 10 rounds, then continues a slower decline to end near 20%. DQL-TFT starts higher but converges with DQL.
3. **Chart 8: "cooperation ratio: DQL vs. TFTbot"**
* **Legend:** DQL (green line), TFTbot (light green line). Legend is top-right.
* **Trend & Data:** The DQL line starts near 60%, declines, and ends near 40%. The TFTbot line starts near 80%, declines sharply initially, then more gradually, ending near 50%. TFTbot maintains a higher cooperation ratio.
4. **Chart 9: "cooperation ratio: SARSA vs. LHACB"**
* **Legend:** SARSA (blue line), LHACB (pink line). Legend is top-right.
* **Trend & Data:** The SARSA line starts near 40%, declines slightly, then plateaus around 30%. The LHACB line starts near 60%, declines sharply to near 20% by round 20, then continues a slow decline. LHACB shows a much steeper drop in cooperation.
5. **Chart 10 (Bottom-Right): "cooperation ratio: LHACB vs. LHACB-TFT vs. DQL"**
* **Legend:** LHACB (pink line), LHACB-TFT (purple line), DQL (blue line). Legend is top-right.
* **Trend & Data:** The LHACB line starts near 60% and declines to near 20%. The LHACB-TFT line starts near 40%, declines very sharply to near 0% by round 20, and stays near zero. The DQL line starts near 40%, declines, and ends near 20%. LHACB-TFT exhibits a complete collapse in cooperation.
### Key Observations
1. **Reward vs. Cooperation Trade-off:** Algorithms that achieve higher normalized rewards (e.g., LHACB-TFT in Chart 5) often show a corresponding sharp decline or collapse in cooperation percentage (Chart 10).
2. **Impact of TFT (Tit-for-Tat):** The addition of a TFT component (e.g., DQL-TFT, LHACB-TFT) generally leads to higher initial rewards but also to more pronounced declines in cooperation over time compared to their base versions.
3. **Performance Hierarchy:** In reward charts, algorithms with "LHACB" in their name (LHACB, LHACB-TFT) consistently appear at the top, suggesting they are the highest-performing agents in this evaluation.
4. **Convergence:** In cooperation charts, most algorithms show a downward trend, converging towards lower cooperation levels (20-40%) by round 50, with the notable exception of LHACB-TFT which converges to near 0%.
### Interpretation
This set of charts likely comes from a study on multi-agent reinforcement learning, specifically examining how different learning algorithms balance individual reward maximization with cooperative behavior in a repeated game or social dilemma scenario (like the Iterated Prisoner's Dilemma).
* **The Core Finding:** The data suggests a fundamental tension. Algorithms designed for higher individual reward (like LHACB-TFT) successfully achieve that goal but at the catastrophic expense of system-wide cooperation. This is a classic illustration of the "tragedy of the commons" in a multi-agent learning context.
* **Algorithm Design Implications:** The "TFT" variants seem to implement a more retaliatory or conditional strategy. While this can boost short-term reward by exploiting cooperative opponents, it triggers an arms race that destroys the cooperative equilibrium, leading to a low-reward, non-cooperative end state for the system (as seen in the final rounds).
* **LHACB Superiority:** The LHACB algorithm appears to be a more sophisticated or effective learner in this environment, as it achieves high rewards while maintaining moderate cooperation longer than simpler algorithms like QL or DQL. However, even it cannot sustain cooperation when paired with its own TFT variant.
* **Anomaly:** The SARSA vs. LHACB cooperation chart (Chart 9) shows an interesting crossover where LHACB's cooperation plummets below SARSA's, despite LHACB earning higher reward. This highlights that the two metrics are not directly inversely correlated for all algorithm pairs; the strategic interaction is complex.
In summary, the image provides strong empirical evidence that in this simulated environment, agent strategies that are most effective at securing individual reward are also the most destructive to cooperative behavior, presenting a clear challenge for designing AI systems meant to operate in social or economic contexts.
DECODING INTELLIGENCE...