## Bar Chart: Answer Hit Comparison for WebQSP and CWQ Datasets
### Overview
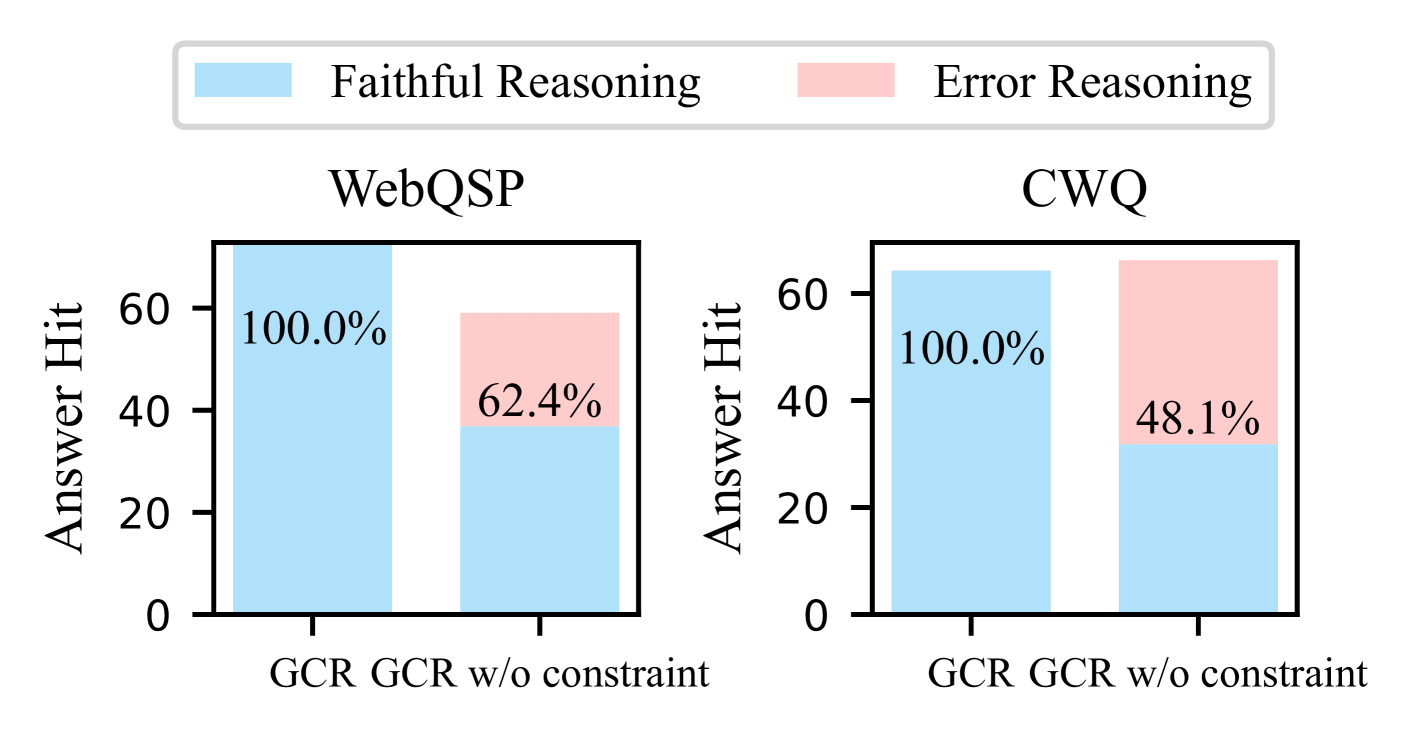
The image presents two bar charts comparing the "Answer Hit" rate for two datasets, WebQSP and CWQ, under two conditions: "GCR" (likely referring to a baseline) and "GCR w/o constraint". The charts show the percentage of correct answers achieved using "Faithful Reasoning" (light blue) and "Error Reasoning" (light pink).
### Components/Axes
* **Title:** The chart is divided into two sub-charts, one labeled "WebQSP" and the other "CWQ".
* **Y-axis:** Labeled "Answer Hit", ranging from 0 to 60. The scale has tick marks at 0, 20, 40, and 60.
* **X-axis:** Categorical axis with two categories: "GCR" and "GCR w/o constraint".
* **Legend:** Located at the top of the image, indicating "Faithful Reasoning" with a light blue bar and "Error Reasoning" with a light pink bar.
### Detailed Analysis
**WebQSP Chart:**
* **GCR:** The "Faithful Reasoning" bar (light blue) reaches 100.0%.
* **GCR w/o constraint:** The "Faithful Reasoning" bar (light blue) reaches 62.4%, and the "Error Reasoning" bar (light pink) reaches approximately 37.6% (100% - 62.4%).
**CWQ Chart:**
* **GCR:** The "Faithful Reasoning" bar (light blue) reaches 100.0%.
* **GCR w/o constraint:** The "Faithful Reasoning" bar (light blue) reaches 48.1%, and the "Error Reasoning" bar (light pink) reaches approximately 51.9% (100% - 48.1%).
### Key Observations
* For both WebQSP and CWQ datasets, the "GCR" condition achieves a 100% "Answer Hit" rate using "Faithful Reasoning".
* When constraints are removed ("GCR w/o constraint"), the "Answer Hit" rate decreases for both datasets. The decrease is more significant for CWQ (from 100% to 48.1%) compared to WebQSP (from 100% to 62.4%).
* The "Error Reasoning" component is only present in the "GCR w/o constraint" condition, indicating that removing constraints introduces errors in reasoning.
### Interpretation
The data suggests that the "GCR" condition, likely representing a constrained or controlled environment, leads to perfect "Answer Hit" rates for both WebQSP and CWQ datasets. Removing constraints ("GCR w/o constraint") negatively impacts the "Answer Hit" rate, indicating that the model's performance degrades when it operates without these constraints. The CWQ dataset appears to be more sensitive to the removal of constraints than the WebQSP dataset, as evidenced by the larger drop in "Answer Hit" rate. This could be due to differences in the complexity or structure of the two datasets. The presence of "Error Reasoning" when constraints are removed suggests that the model relies on less reliable or incorrect reasoning processes in the absence of constraints.