## Diagram: Causal Diagram and Ternary Plot
### Overview
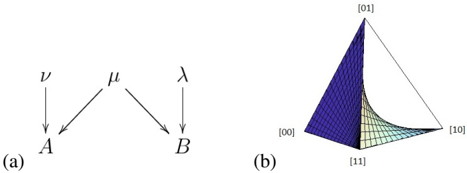
The image presents two diagrams side-by-side. Diagram (a) is a causal diagram showing relationships between variables, while diagram (b) is a ternary plot illustrating a distribution across three components.
### Components/Axes
**Diagram (a): Causal Diagram**
* **Nodes:** A, B
* **Variables:** ν (above A), μ (above and between A and B), λ (above B)
* **Edges:** Directed edges (arrows) indicate causal relationships.
* ν -> A
* μ -> A
* μ -> B
* λ -> B
**Diagram (b): Ternary Plot**
* **Vertices:** [00], [01], [10], [11]
* **Plot Area:** A curved surface is plotted within the ternary space, with color gradient. The surface is dark blue near the [01] vertex and transitions to lighter colors towards the [11] and [10] vertices.
### Detailed Analysis
**Diagram (a): Causal Diagram**
The diagram shows that variable A is influenced by variables ν and μ. Variable B is influenced by variables μ and λ.
**Diagram (b): Ternary Plot**
The ternary plot shows a distribution where the highest values (dark blue) are concentrated near the [01] vertex. The values decrease as you move towards the [10] and [11] vertices. The region near the [00] vertex is not explicitly shown, but the surface suggests low values in that area.
### Key Observations
* **Causal Diagram:** The variable μ has an influence on both A and B, suggesting it might be a confounding variable.
* **Ternary Plot:** The distribution is heavily skewed towards the [01] component.
### Interpretation
The causal diagram (a) represents a system where two variables, A and B, are influenced by different factors. The presence of μ influencing both A and B suggests a potential correlation between A and B that might not be directly causal.
The ternary plot (b) visualizes a distribution across four components, [00], [01], [10], and [11]. The plot indicates that the [01] component dominates, while the other components have significantly lower values. This could represent a probability distribution, a composition of a mixture, or any other scenario where three components sum to a constant.