## Diagram: Bidirectional Interaction and 3D Geometric Structure
### Overview
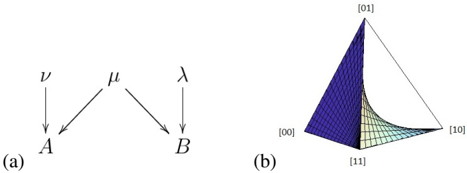
The image contains two distinct components:
1. **Diagram (a)**: A bidirectional relationship between points **A** and **B** with labeled arrows.
2. **Diagram (b)**: A 3D pyramid-like structure with labeled faces and a color gradient.
---
### Components/Axes
#### Diagram (a):
- **Labels**:
- Arrows from **A** to **B**: **ν** (vertical), **μ** (diagonal).
- Arrow from **B** to **A**: **λ** (vertical).
- **Flow**:
- **A** → **B** via **ν** and **μ**.
- **B** → **A** via **λ**.
#### Diagram (b):
- **Axes/Face Labels**:
- Top face: **[01]**
- Left face: **[00]**
- Right face: **[11]**
- Base face: **[10]**
- **Color Gradient**:
- Top-to-bottom gradient: **blue** (apex) → **green** → **yellow** (base).
- **No explicit legend** for the gradient.
---
### Detailed Analysis
#### Diagram (a):
- **Arrows**:
- **ν**: Direct vertical connection from **A** to **B**.
- **μ**: Diagonal connection from **A** to **B**.
- **λ**: Direct vertical connection from **B** to **A**.
- **Interpretation**:
- Represents a system with two-way interactions (**A** ↔ **B**) mediated by three distinct pathways (**ν**, **μ**, **λ**).
#### Diagram (b):
- **Structure**:
- A tetrahedral pyramid with triangular faces.
- Face labels resemble **Miller indices** (common in crystallography), suggesting a geometric or material science context.
- **Color Gradient**:
- **Blue** at the apex ([01] face) transitions to **yellow** at the base ([10] face).
- No numerical scale provided; gradient likely represents a scalar quantity (e.g., stress, energy, or concentration).
---
### Key Observations
1. **Diagram (a)**:
- Symmetry in vertical arrows (**ν** and **λ**) suggests reciprocal interactions.
- Diagonal arrow (**μ**) implies a non-linear or secondary pathway.
2. **Diagram (b)**:
- Face labels **[01]**, **[00]**, **[11]**, **[10]** align with crystallographic plane notation.
- Color gradient may indicate a property varying with depth or orientation.
---
### Interpretation
- **Diagram (a)**:
- Likely models a physical or abstract system with bidirectional interactions (e.g., chemical reactions, data flow, or mechanical forces). The labels **ν**, **μ**, **λ** could represent velocity, momentum, and wavelength, respectively, depending on context.
- **Diagram (b)**:
- The 3D structure resembles a **Wulff shape** or **Voronoi cell**, common in materials science to represent equilibrium configurations.
- The color gradient might correlate with a property like **surface energy** or **defect density**, with **blue** (low values) at the apex and **yellow** (high values) at the base.
- **Relationships**:
- Diagram (a) could represent interactions between planes or phases in the 3D structure (b), with **ν**, **μ**, **λ** governing transitions between crystallographic orientations.
---
### Notes on Missing Data
- No numerical values or explicit units are provided.
- The color gradient in (b) lacks a legend, limiting quantitative interpretation.
- Assumptions about crystallography are based on Miller index notation; alternative contexts (e.g., quantum states) are possible.