## State Transition Diagram: Finite State Automaton for Process $u^2$
### Overview
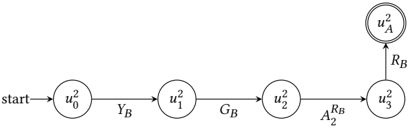
The image displays a directed graph representing a finite state machine or a sequential process flow. The diagram illustrates a linear progression of states starting from an initial state ($u_0^2$) and terminating at a final, accepting state ($u_A^2$). The transitions between these states are labeled with specific identifiers, likely representing inputs, conditions, or chemical/biological reaction steps.
### Components/Axes
* **Nodes (States):** Represented by circles containing text.
* $u_0^2$: Initial state.
* $u_1^2$: Intermediate state 1.
* $u_2^2$: Intermediate state 2.
* $u_3^2$: Intermediate state 3.
* $u_A^2$: Final/Accepting state (indicated by a double-circle border).
* **Transitions (Edges):** Represented by arrows connecting the nodes.
* **Start:** An arrow pointing from the left to $u_0^2$.
* **$Y_B$:** Transition from $u_0^2$ to $u_1^2$.
* **$G_B$:** Transition from $u_1^2$ to $u_2^2$.
* **$A_2^{R_B}$:** Transition from $u_2^2$ to $u_3^2$.
* **$R_B$:** Transition from $u_3^2$ to $u_A^2$.
### Detailed Analysis
The diagram is structured as a horizontal chain that terminates with a vertical branch.
1. **Initial State ($u_0^2$):** Located at the far left. The "start" indicator confirms this is the entry point of the process.
2. **Horizontal Progression:**
* The process moves from $u_0^2$ to $u_1^2$ via the $Y_B$ transition.
* The process moves from $u_1^2$ to $u_2^2$ via the $G_B$ transition.
* The process moves from $u_2^2$ to $u_3^2$ via the $A_2^{R_B}$ transition.
3. **Terminal Branch:**
* From $u_3^2$, the process moves vertically upward to the final state $u_A^2$ via the $R_B$ transition.
4. **Final State ($u_A^2$):** Located at the top right of the diagram. It is distinguished from the other nodes by a double-line circular border, which is standard notation in automata theory to denote an "accepting" or "final" state.
### Key Observations
* **Linearity:** The process is strictly deterministic and linear; there are no loops or branching paths shown.
* **Notation:** The superscript "2" is consistent across all state labels ($u_0^2$ through $u_A^2$), suggesting these states belong to a specific category or set of processes denoted by the index 2.
* **Transition Complexity:** The transition labels vary in complexity. While $Y_B$, $G_B$, and $R_B$ appear to be simple identifiers, the label $A_2^{R_B}$ is more complex, potentially indicating a conditional transition or a specific sub-process occurring between state $u_2^2$ and $u_3^2$.
### Interpretation
This diagram represents a **Deterministic Finite Automaton (DFA)** or a **Process Flowchart**.
* **Function:** It maps the lifecycle of a system or reaction. The system begins in state $u_0^2$ and must undergo four distinct transitions ($Y_B, G_B, A_2^{R_B}, R_B$) to reach the successful completion state $u_A^2$.
* **Contextual Inference:** Given the notation (using $Y, G, R, A, B$), this could represent a biological pathway, a chemical synthesis sequence, or a computational state machine. For example, if this were a chemical process, the labels might represent reagents or catalysts required to move from one intermediate state to the next.
* **Structural Anomaly:** The transition from $u_3^2$ to $u_A^2$ is the only vertical movement in the diagram, visually separating the final state from the horizontal sequence. This might imply that the final state $u_A^2$ is distinct in nature (e.g., a product or a different phase) compared to the intermediate states $u_0^2$ through $u_3^2$.