\n
## Diagram: State Transition Diagram
### Overview
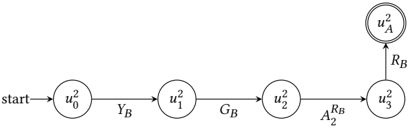
The image depicts a state transition diagram with four states labeled u₀², u₁², u₂², and u₃², along with a final state uₐ². Arrows indicate transitions between states, labeled with variables Y<sub>B</sub>, G<sub>B</sub>, A₂<sup>R<sub>B</sub></sup>, and R<sub>B</sub>. The diagram starts at state u₀².
### Components/Axes
The diagram consists of:
* **States:** Represented by circles labeled u₀², u₁², u₂², u₃², and uₐ².
* **Transitions:** Represented by arrows connecting the states, labeled with variables.
* **Start State:** Indicated by the label "start" pointing to state u₀².
* **Final State:** State uₐ² is double-circled, indicating a final state.
* **Labels:**
* u₀²
* u₁²
* u₂²
* u₃²
* uₐ²
* Y<sub>B</sub>
* G<sub>B</sub>
* A₂<sup>R<sub>B</sub></sup>
* R<sub>B</sub>
* start
### Detailed Analysis / Content Details
The diagram shows a sequential flow of states:
1. **Start to u₁²:** A transition from the "start" point to state u₀² is indicated. Then, a transition from u₀² to u₁² is labeled with Y<sub>B</sub>.
2. **u₁² to u₂²:** A transition from u₁² to u₂² is labeled with G<sub>B</sub>.
3. **u₂² to u₃²:** A transition from u₂² to u₃² is labeled with A₂<sup>R<sub>B</sub></sup>.
4. **u₃² to uₐ²:** A transition from u₃² to the final state uₐ² is labeled with R<sub>B</sub>.
### Key Observations
The diagram represents a process that moves through a series of states, each transition governed by a variable. The final state is uₐ². The variables Y<sub>B</sub>, G<sub>B</sub>, A₂<sup>R<sub>B</sub></sup>, and R<sub>B</sub> likely represent conditions or events that trigger the transitions.
### Interpretation
This diagram likely represents a model of a system or process that progresses through distinct stages. The variables associated with each transition suggest that the system's behavior is dependent on certain parameters or conditions (represented by the subscript 'B'). The superscript '2' on the state labels might indicate a squared value or a specific version of the state. The final state uₐ² signifies the completion of the process. Without further context, it's difficult to determine the specific nature of the system or process being modeled, but the diagram provides a clear visual representation of its state transitions. The variables suggest a mathematical or engineering context, potentially related to control systems or signal processing.