## Line Chart: Accuracy vs. Input Size for Different 'r' Values
### Overview
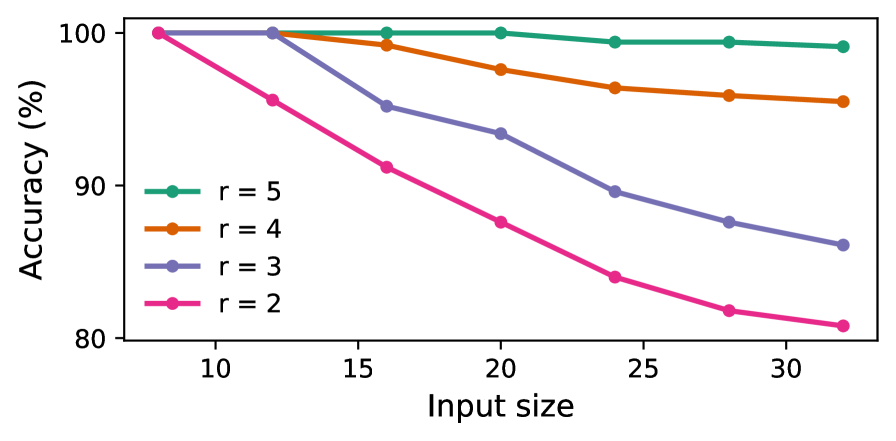
The image is a line chart showing the relationship between "Input size" (x-axis) and "Accuracy (%)" (y-axis) for four different values of a parameter 'r'. The chart displays four lines, each representing a different 'r' value (r=2, r=3, r=4, r=5). The x-axis ranges from approximately 8 to 32, and the y-axis ranges from 80 to 100.
### Components/Axes
* **X-axis:** "Input size", with tick marks at 10, 15, 20, 25, and 30.
* **Y-axis:** "Accuracy (%)", with tick marks at 80, 90, and 100.
* **Legend:** Located on the left side of the chart, indicating the color-coded lines for each 'r' value:
* Green: r = 5
* Orange: r = 4
* Purple: r = 3
* Pink: r = 2
### Detailed Analysis
* **r = 5 (Green):** The green line representing r=5 starts at approximately 100% accuracy and remains relatively stable, decreasing slightly to around 99% as the input size increases.
* (10, 100)
* (15, 100)
* (20, 100)
* (25, 99)
* (30, 99)
* **r = 4 (Orange):** The orange line representing r=4 starts at approximately 100% accuracy and decreases gradually to around 96% as the input size increases.
* (10, 100)
* (15, 100)
* (20, 97)
* (25, 97)
* (30, 95)
* **r = 3 (Purple):** The purple line representing r=3 starts at approximately 100% accuracy and decreases more significantly than r=4, reaching around 86% as the input size increases.
* (10, 100)
* (15, 100)
* (20, 93)
* (25, 89)
* (30, 86)
* **r = 2 (Pink):** The pink line representing r=2 starts at approximately 100% accuracy and decreases sharply, reaching around 82% as the input size increases.
* (10, 100)
* (15, 93)
* (20, 88)
* (25, 84)
* (30, 82)
### Key Observations
* As the input size increases, the accuracy generally decreases for all values of 'r'.
* The rate of accuracy decrease is more pronounced for lower values of 'r' (r=2 and r=3) compared to higher values (r=4 and r=5).
* The accuracy for r=5 remains relatively stable across the range of input sizes.
* The accuracy for r=2 experiences the most significant drop as the input size increases.
### Interpretation
The chart suggests that the parameter 'r' plays a crucial role in maintaining accuracy as the input size increases. Higher values of 'r' appear to provide greater stability and resistance to accuracy degradation with increasing input size. Conversely, lower values of 'r' result in a more significant decline in accuracy as the input size grows. This could indicate that 'r' represents a form of regularization or a capacity control parameter, where higher values prevent overfitting to smaller input sizes, thus maintaining performance as the input size increases. The data demonstrates a clear trade-off between 'r' and accuracy stability with respect to input size.