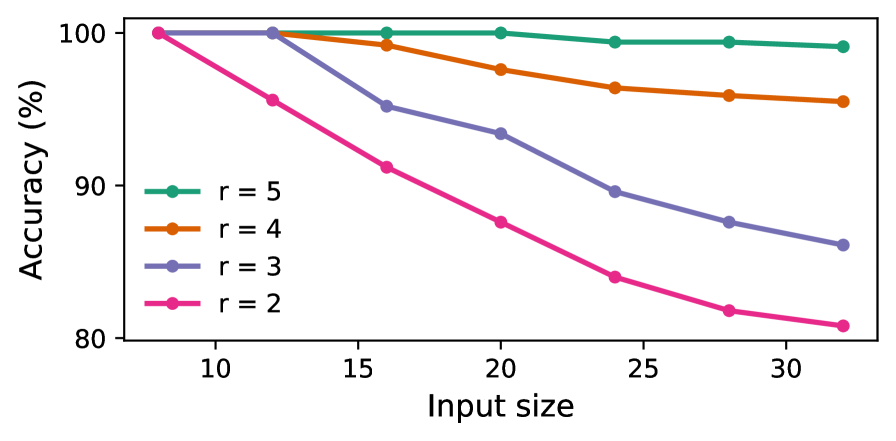
## Line Chart: Accuracy vs. Input Size for Different 'r' Values
### Overview
This line chart depicts the relationship between input size and accuracy for four different values of 'r' (r=2, 3, 4, and 5). The chart shows how accuracy changes as the input size increases for each 'r' value.
### Components/Axes
* **X-axis:** Input size, ranging from approximately 10 to 30.
* **Y-axis:** Accuracy (%), ranging from approximately 80% to 100%.
* **Legend:** Located in the top-left corner, identifies the lines by their corresponding 'r' values:
* r = 5 (Green)
* r = 4 (Orange)
* r = 3 (Gray/Purple)
* r = 2 (Magenta/Pink)
### Detailed Analysis
The chart contains four distinct lines, each representing a different 'r' value.
* **r = 5 (Green):** The line starts at approximately 99% accuracy at an input size of 10 and decreases slightly to approximately 97% accuracy at an input size of 30. The trend is relatively flat, indicating minimal change in accuracy with increasing input size.
* (10, 99%)
* (15, 98%)
* (20, 97%)
* (25, 97%)
* (30, 97%)
* **r = 4 (Orange):** The line begins at approximately 98% accuracy at an input size of 10 and decreases to approximately 94% accuracy at an input size of 30. The slope is more pronounced than that of r=5, indicating a greater sensitivity to input size.
* (10, 98%)
* (15, 97%)
* (20, 96%)
* (25, 95%)
* (30, 94%)
* **r = 3 (Gray/Purple):** The line starts at approximately 97% accuracy at an input size of 10 and decreases to approximately 89% accuracy at an input size of 30. The slope is steeper than both r=4 and r=5.
* (10, 97%)
* (15, 94%)
* (20, 92%)
* (25, 90%)
* (30, 89%)
* **r = 2 (Magenta/Pink):** The line begins at approximately 98% accuracy at an input size of 10 and decreases significantly to approximately 82% accuracy at an input size of 30. This line has the steepest slope, indicating the most substantial decrease in accuracy with increasing input size.
* (10, 98%)
* (15, 93%)
* (20, 88%)
* (25, 85%)
* (30, 82%)
### Key Observations
* Accuracy generally decreases as input size increases for all 'r' values.
* The rate of accuracy decrease is heavily influenced by the value of 'r'. Lower 'r' values exhibit a more rapid decline in accuracy with increasing input size.
* For smaller input sizes (around 10), all 'r' values achieve high accuracy (close to 100%).
* The line for r=5 maintains the highest accuracy across all input sizes.
### Interpretation
The data suggests that the parameter 'r' plays a crucial role in maintaining accuracy as the input size grows. Higher values of 'r' appear to provide greater robustness against the negative impact of increasing input size on accuracy. This could indicate that 'r' controls a level of complexity or regularization within the model, preventing overfitting or maintaining generalization performance as the data becomes more extensive. The steep decline in accuracy for r=2 suggests that this value may be insufficient to handle larger input sizes effectively. The chart demonstrates a trade-off between input size and accuracy, where increasing input size can lead to decreased accuracy, particularly for lower values of 'r'. This information is valuable for selecting an appropriate 'r' value based on the expected input size and desired accuracy level.