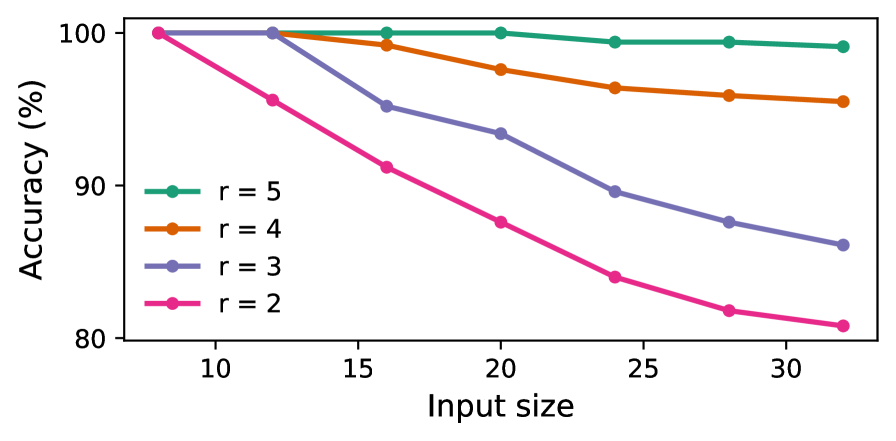
## Line Chart: Accuracy vs. Input Size for Different 'r' Values
### Overview
The image is a line chart displaying the relationship between "Input size" (x-axis) and "Accuracy (%)" (y-axis) for four different series, each corresponding to a distinct value of a parameter labeled 'r'. The chart demonstrates how accuracy changes as input size increases, with the rate of change dependent on the 'r' value.
### Components/Axes
* **X-Axis:** Labeled "Input size". Major tick marks are present at values 10, 15, 20, 25, and 30. The axis spans from approximately 8 to 32.
* **Y-Axis:** Labeled "Accuracy (%)". Major tick marks are present at values 80, 90, and 100. The axis spans from 80 to 100.
* **Legend:** Positioned in the top-left quadrant of the chart area. It contains four entries, each with a colored line segment and a label:
* Green line with circle markers: `r = 5`
* Orange line with circle markers: `r = 4`
* Purple line with circle markers: `r = 3`
* Pink line with circle markers: `r = 2`
### Detailed Analysis
The chart contains four data series, each plotted as a line with circular markers at data points. The general trend for all series is a decrease in accuracy as input size increases, but the severity of the decline varies significantly with 'r'.
**1. Series: r = 5 (Green Line)**
* **Trend:** The line is nearly horizontal, showing a very slight downward slope. It represents the highest and most stable accuracy across all input sizes.
* **Approximate Data Points:**
* Input Size ~8: Accuracy ~100%
* Input Size ~12: Accuracy ~100%
* Input Size ~16: Accuracy ~100%
* Input Size ~20: Accuracy ~100%
* Input Size ~24: Accuracy ~99.5%
* Input Size ~28: Accuracy ~99.5%
* Input Size ~32: Accuracy ~99%
**2. Series: r = 4 (Orange Line)**
* **Trend:** The line shows a moderate, steady downward slope. Accuracy decreases gradually with larger input sizes.
* **Approximate Data Points:**
* Input Size ~8: Accuracy ~100%
* Input Size ~12: Accuracy ~100%
* Input Size ~16: Accuracy ~99%
* Input Size ~20: Accuracy ~97.5%
* Input Size ~24: Accuracy ~96.5%
* Input Size ~28: Accuracy ~96%
* Input Size ~32: Accuracy ~95.5%
**3. Series: r = 3 (Purple Line)**
* **Trend:** The line shows a pronounced downward slope, steeper than the r=4 series. Accuracy drops significantly as input size grows.
* **Approximate Data Points:**
* Input Size ~8: Accuracy ~100%
* Input Size ~12: Accuracy ~100%
* Input Size ~16: Accuracy ~95%
* Input Size ~20: Accuracy ~93%
* Input Size ~24: Accuracy ~89.5%
* Input Size ~28: Accuracy ~87.5%
* Input Size ~32: Accuracy ~86%
**4. Series: r = 2 (Pink Line)**
* **Trend:** The line shows the steepest downward slope of all series. Accuracy degrades rapidly with increasing input size.
* **Approximate Data Points:**
* Input Size ~8: Accuracy ~100%
* Input Size ~12: Accuracy ~95.5%
* Input Size ~16: Accuracy ~91%
* Input Size ~20: Accuracy ~87.5%
* Input Size ~24: Accuracy ~84%
* Input Size ~28: Accuracy ~82%
* Input Size ~32: Accuracy ~81%
### Key Observations
1. **Inverse Relationship:** For all series, accuracy is inversely related to input size. As input size increases, accuracy decreases.
2. **Parameter 'r' as a Stabilizer:** The value of 'r' has a strong positive correlation with performance stability. Higher 'r' values (5, 4) result in much flatter curves and higher final accuracy at large input sizes compared to lower 'r' values (3, 2).
3. **Convergence at Small Inputs:** All four series converge at or near 100% accuracy for the smallest input sizes (around 8-12). The divergence in performance becomes pronounced only as input size increases beyond ~12.
4. **Performance Hierarchy:** The order of performance (from highest to lowest accuracy) is strictly maintained across all input sizes: r=5 > r=4 > r=3 > r=2. The lines do not cross.
### Interpretation
This chart likely illustrates the performance of a computational model or algorithm where 'r' represents a key hyperparameter, such as model rank, capacity, or complexity. The data suggests that:
* **Model Robustness:** Models with higher 'r' values are more robust to increases in input size. They maintain near-perfect accuracy even as the problem scale grows.
* **Capacity Limitation:** Models with lower 'r' values (r=2, r=3) appear to have a limited capacity. Their performance degrades sharply when faced with larger, presumably more complex, inputs, indicating they may be underfitting or lack the necessary parameters to capture the patterns in larger datasets.
* **Practical Implication:** There is a clear trade-off. If computational resources allow, using a higher 'r' value is preferable for ensuring consistent accuracy across varying input sizes. However, if 'r' correlates with cost (e.g., memory, time), a designer must choose the minimum 'r' that meets the accuracy requirements for the expected range of input sizes. The chart provides the empirical data needed to make that engineering decision.
* **Underlying Phenomenon:** The consistent, non-intersecting fan-out pattern from a common starting point is characteristic of a system where a single parameter ('r') controls the system's ability to generalize or scale. The investigation would next focus on what 'r' physically represents and why it has this specific scaling effect.