\n
## Bar Chart: Robustness - Stability Across Multiple Runs
### Overview
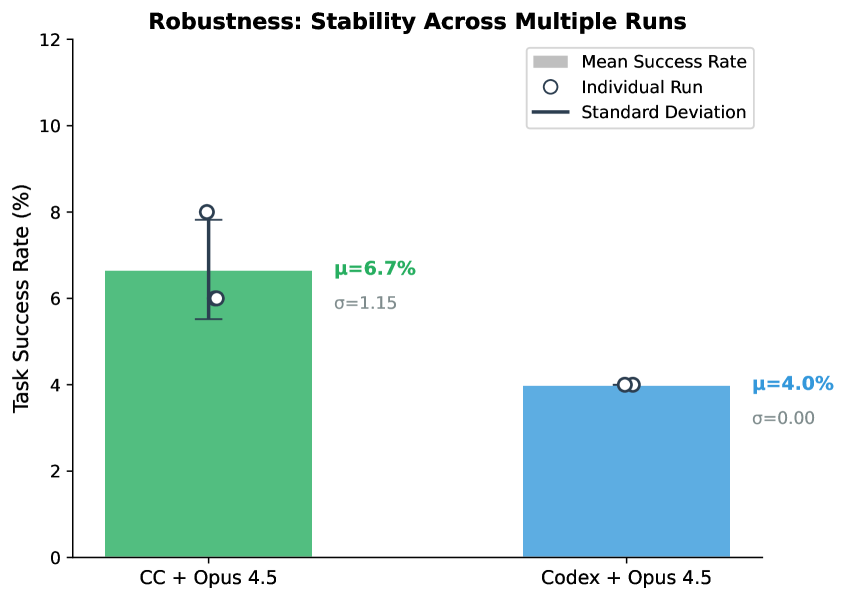
This bar chart compares the Task Success Rate between two configurations: "CC + Opus 4.5" and "Codex + Opus 4.5". Each configuration's success rate is represented by a green or blue bar, respectively, with error bars indicating standard deviation. Mean success rates (μ) and standard deviations (σ) are displayed directly on the chart.
### Components/Axes
* **Title:** Robustness: Stability Across Multiple Runs
* **X-axis:** Configuration (CC + Opus 4.5, Codex + Opus 4.5)
* **Y-axis:** Task Success Rate (%) - Scale ranges from 0 to 12, with increments of 2.
* **Legend:**
* Mean Success Rate (Green)
* Individual Run (Circle)
* Standard Deviation (Black Line)
### Detailed Analysis
The chart presents data for two configurations:
**1. CC + Opus 4.5:**
* Bar Color: Green
* Mean Success Rate (μ): Approximately 6.7% (displayed text: μ=6.7%)
* Standard Deviation (σ): Approximately 1.15% (displayed text: σ=1.15)
* Error Bar: Extends from approximately 5.5% to 8.0%.
* Individual Run: Marked by a circle at approximately 5.7%
**2. Codex + Opus 4.5:**
* Bar Color: Blue
* Mean Success Rate (μ): Approximately 4.0% (displayed text: μ=4.0%)
* Standard Deviation (σ): 0.0% (displayed text: σ=0.00)
* Error Bar: A horizontal line at approximately 4.0%
* Individual Run: Marked by a circle at approximately 4.0%
### Key Observations
* The "CC + Opus 4.5" configuration has a higher mean success rate (6.7%) compared to the "Codex + Opus 4.5" configuration (4.0%).
* The "CC + Opus 4.5" configuration exhibits a standard deviation of 1.15%, indicating variability in the success rate across multiple runs.
* The "Codex + Opus 4.5" configuration has a standard deviation of 0.0%, suggesting consistent performance across runs.
* The individual run data point for "CC + Opus 4.5" is slightly above the mean, while the individual run data point for "Codex + Opus 4.5" is exactly on the mean.
### Interpretation
The data suggests that the "CC + Opus 4.5" configuration is more effective in terms of average task success rate, but also demonstrates greater variability in performance. The "Codex + Opus 4.5" configuration, while having a lower average success rate, provides more consistent results. The zero standard deviation for Codex + Opus 4.5 is notable; it suggests either a very small number of runs were performed, or the system is remarkably stable. The difference in standard deviation implies that the CC + Opus 4.5 configuration is more sensitive to external factors or variations in input, while Codex + Opus 4.5 is more robust. Further investigation would be needed to understand the source of the variability in the CC + Opus 4.5 configuration and the reasons for the lower overall success rate of Codex + Opus 4.5. The chart highlights a trade-off between average performance and consistency.