## Bar Chart: Robustness: Stability Across Multiple Runs
### Overview
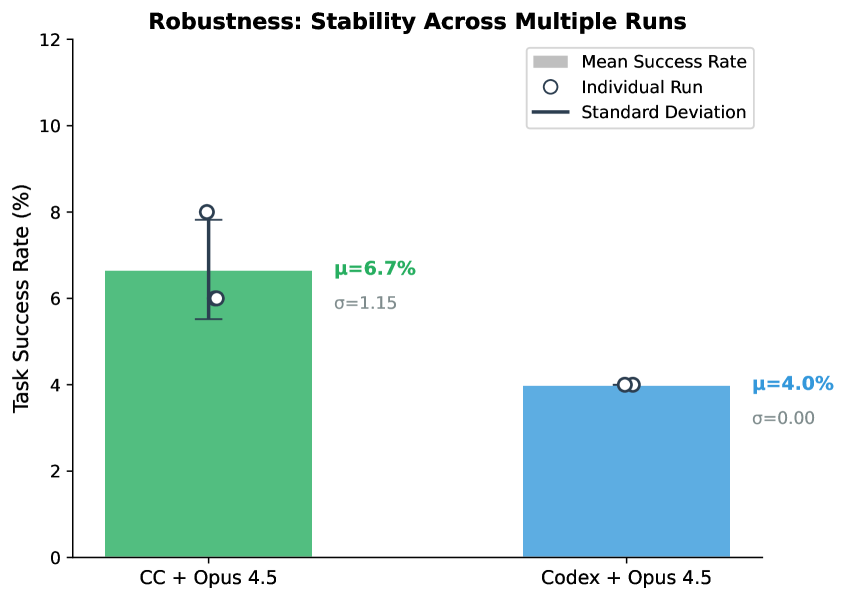
The chart compares task success rates between two systems: "CC + Opus 4.5" and "Codex + Opus 4.5" across multiple runs. It visualizes mean success rates, individual run variability, and standard deviations using bars, error bars, and data points.
### Components/Axes
- **X-Axis**: Categories labeled "CC + Opus 4.5" (green) and "Codex + Opus 4.5" (blue).
- **Y-Axis**: Task Success Rate (%) ranging from 0 to 12.
- **Legend**: Located in the top-right corner, with three elements:
- Gray bar: Mean Success Rate
- White circle with black outline: Individual Run
- Dark blue line: Standard Deviation
### Detailed Analysis
1. **CC + Opus 4.5 (Green Bar)**:
- Mean Success Rate (gray bar): 6.7% (μ=6.7%)
- Standard Deviation (dark blue line): σ=1.15
- Individual Run (white circle): ~6% (below mean)
- Error bar: Extends from ~5.5% to ~8% (mean ± σ)
2. **Codex + Opus 4.5 (Blue Bar)**:
- Mean Success Rate (gray bar): 4.0% (μ=4.0%)
- Standard Deviation (dark blue line): σ=0.00
- Individual Run (white circle): 4.0% (matches mean exactly)
- Error bar: No visible deviation (σ=0.00)
### Key Observations
- **CC + Opus 4.5** shows higher mean performance (6.7% vs. 4.0%) but significant variability (σ=1.15).
- **Codex + Opus 4.5** demonstrates perfect consistency (σ=0.00) but lower effectiveness.
- The individual run for CC + Opus 4.5 (6%) is slightly below its mean, while Codex + Opus 4.5's individual run aligns perfectly with its mean.
### Interpretation
The data suggests a trade-off between performance and stability:
- **CC + Opus 4.5** achieves higher task success rates on average but exhibits instability across runs (high σ=1.15), indicating potential sensitivity to input variations or implementation differences.
- **Codex + Opus 4.5** prioritizes reliability (σ=0.00) at the cost of lower mean performance, suggesting deterministic behavior or optimized consistency.
- The near-perfect alignment of the individual run with the mean for Codex + Opus 4.5 implies no observed variability in its outcomes, which could stem from algorithmic design or controlled testing conditions.
- The error bars visually reinforce these conclusions: CC + Opus 4.5's wide error range contrasts sharply with Codex + Opus 4.5's absence of error bars.