## Bar Chart: Yearwise Average Reference Count
### Overview
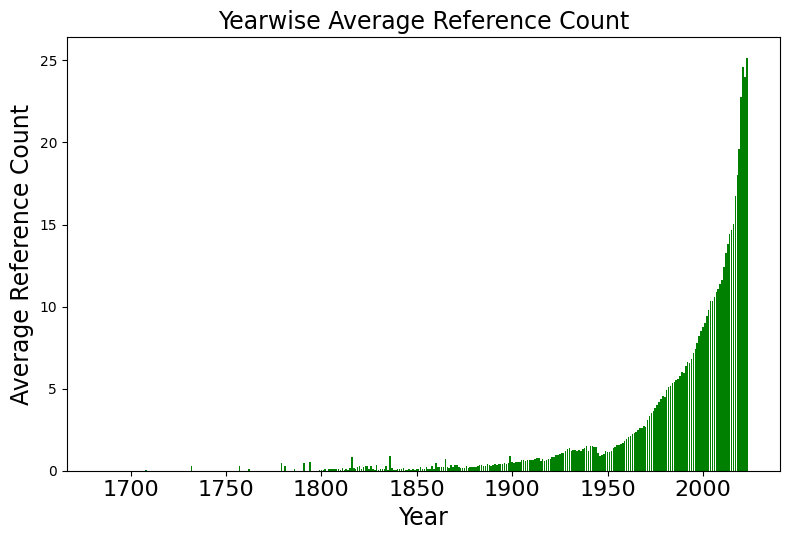
The image is a bar chart showing the yearwise average reference count. The x-axis represents the year, ranging from 1700 to 2000. The y-axis represents the average reference count, ranging from 0 to 25. The chart shows a general upward trend, indicating an increase in the average reference count over time.
### Components/Axes
* **Title:** Yearwise Average Reference Count
* **X-axis:** Year
* Scale: 1700 to 2000
* Markers: 1700, 1750, 1800, 1850, 1900, 1950, 2000
* **Y-axis:** Average Reference Count
* Scale: 0 to 25
* Markers: 0, 5, 10, 15, 20, 25
* **Bars:** Green bars representing the average reference count for each year.
### Detailed Analysis
* From 1700 to approximately 1800, the average reference count is very low, close to 0.
* Between 1800 and 1900, there is a slight increase in the average reference count, but it remains relatively low, generally below 1.
* From 1900 to 1950, the average reference count gradually increases, reaching approximately 2.
* From 1950 to 2000, there is a significant increase in the average reference count, rising from approximately 2 to over 20.
* The highest average reference counts are observed in the years closest to 2000, with the last few years exceeding 20.
### Key Observations
* The average reference count remains relatively stable and low until around 1900.
* A significant increase in the average reference count occurs after 1950.
* The years near 2000 show the highest average reference counts.
### Interpretation
The bar chart suggests a strong positive correlation between the year and the average reference count. The number of references in publications has increased dramatically in recent years. This could be due to several factors, such as the increasing availability of research materials, the growing complexity of research topics, or changes in citation practices. The relatively low reference counts before 1900 may reflect the limited availability of published research and different scholarly practices during that time. The sharp increase after 1950 likely reflects the post-war expansion of scientific research and the increasing interconnectedness of the research community.