\n
## Line Chart: Yearwise Average Reference Count
### Overview
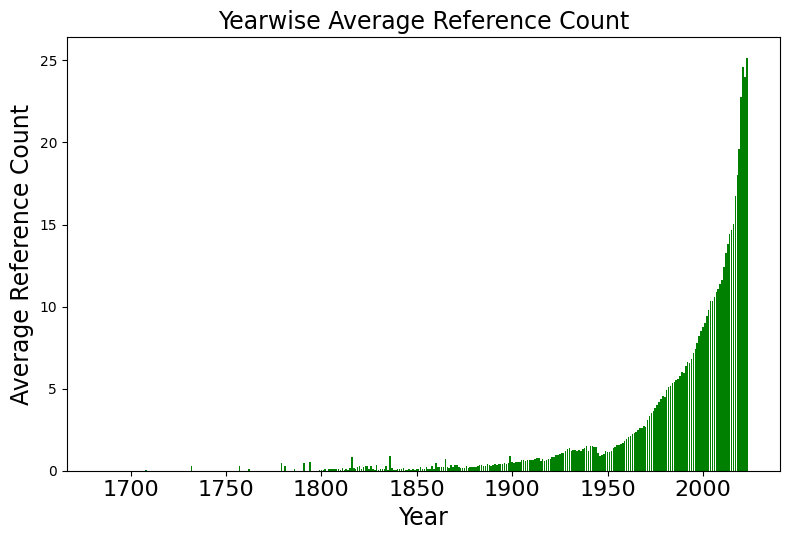
The image presents a line chart illustrating the yearwise average reference count. The chart spans from approximately 1700 to 2023, showing a dramatic increase in average reference count in the later years.
### Components/Axes
* **Title:** "Yearwise Average Reference Count" - positioned at the top-center of the chart.
* **X-axis:** "Year" - ranging from 1700 to 2023, with tick marks every 50 years.
* **Y-axis:** "Average Reference Count" - ranging from 0 to 25, with tick marks every 5 units.
* **Data Series:** A single green line representing the yearwise average reference count.
### Detailed Analysis
The line representing the average reference count remains very close to zero from 1700 to approximately 1950. The line begins to show a slight upward trend around 1950, gradually increasing until approximately 2000. After 2000, the line exhibits an exponential increase, reaching a peak of approximately 24 at the year 2023.
Here's a breakdown of approximate values at specific years:
* **1700:** ~0.1
* **1750:** ~0.2
* **1800:** ~0.3
* **1850:** ~0.4
* **1900:** ~0.5
* **1950:** ~1.0
* **2000:** ~5.0
* **2005:** ~10.0
* **2010:** ~15.0
* **2015:** ~20.0
* **2020:** ~23.0
* **2023:** ~24.0
The trend is nearly flat for the first 250 years, then gradually increasing, and then rapidly accelerating in the last 70 years.
### Key Observations
* The average reference count is extremely low before 1950.
* The most significant increase in average reference count occurs after the year 2000.
* The growth appears to be exponential in the most recent decades.
### Interpretation
The data suggests a dramatic increase in the frequency of references over time. This could be due to several factors, including:
* **Increased publication rates:** More research being conducted and published.
* **Improved indexing and databases:** Making it easier to find and cite references.
* **Growth of academic disciplines:** Expansion of knowledge and the need to build upon previous work.
* **The rise of digital publishing:** Facilitating easier access to and citation of research.
The sharp increase after 2000 likely reflects the widespread adoption of digital publishing and online databases, which have revolutionized the way research is conducted and disseminated. The near-zero values before 1950 suggest that systematic referencing was either not common or not well-recorded during that period. The chart demonstrates a clear correlation between time and the average number of references, indicating a significant shift in the scholarly landscape over the past few centuries.