## Diagram: Physics Concept Network - "K" Domain
### Overview
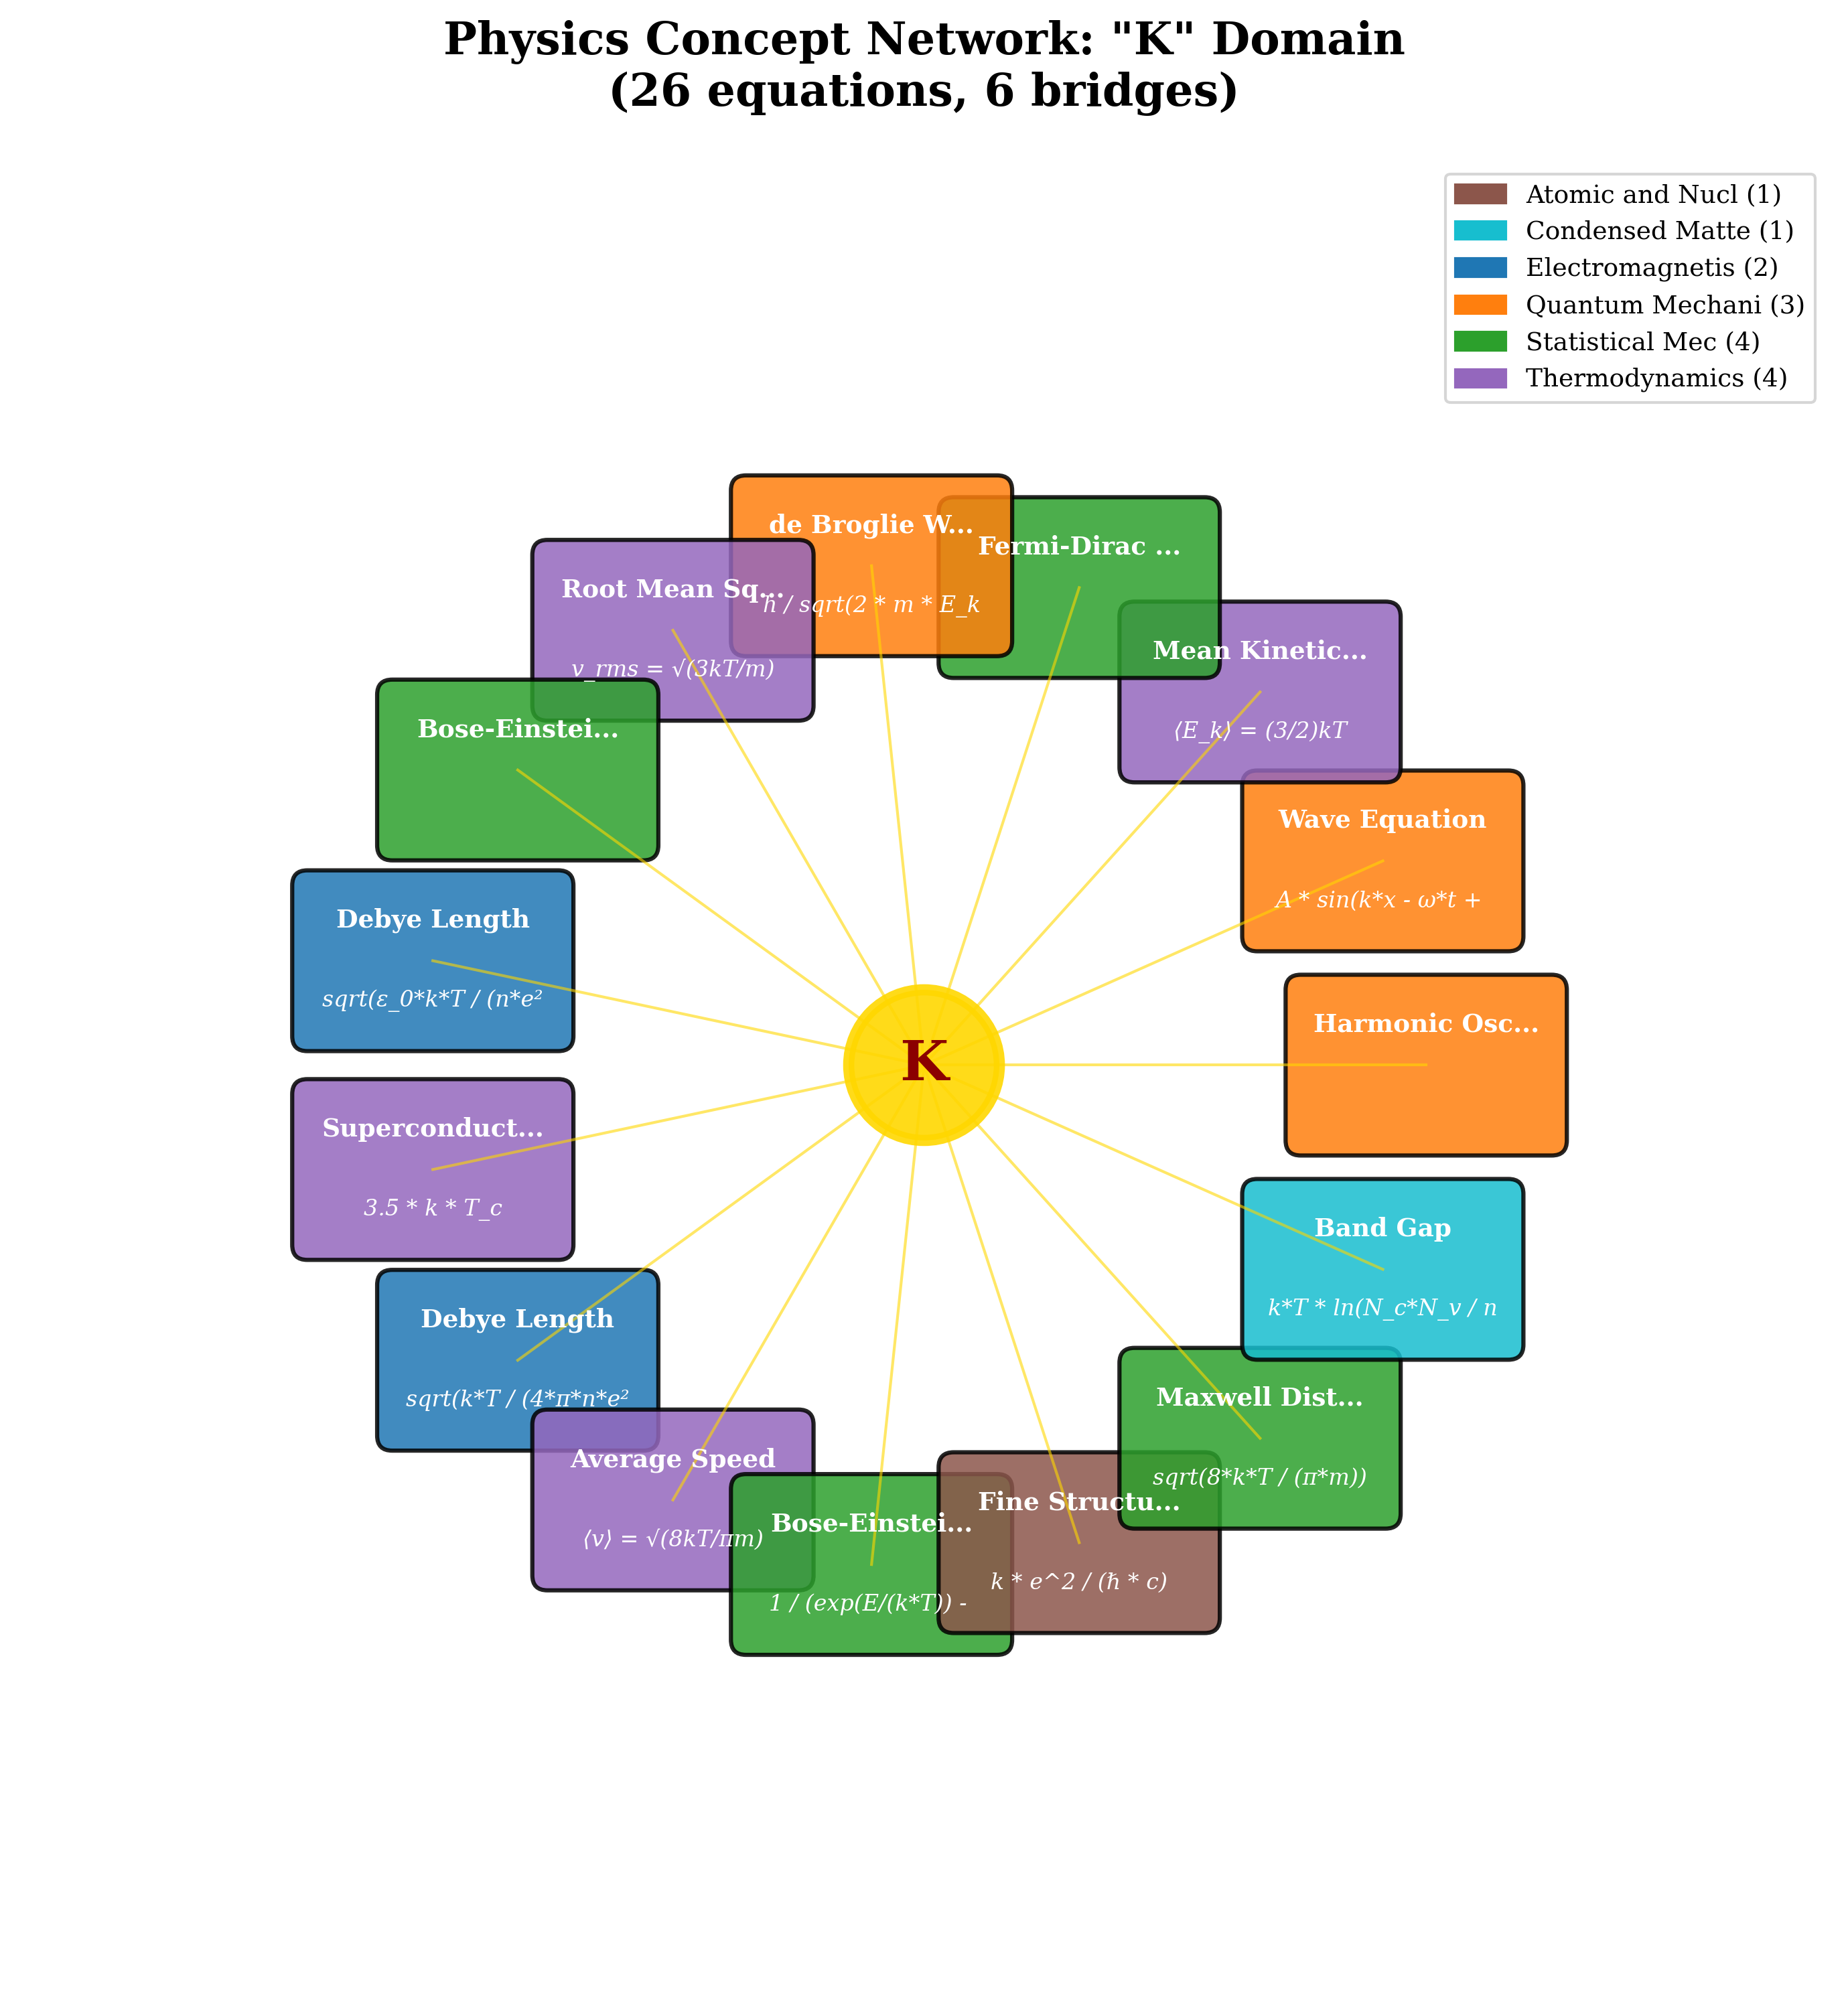
This diagram represents a concept network centered around the variable "K" in physics. It visually connects various physics concepts and equations to "K" through radial lines. The concepts are color-coded based on their respective physics domains. The diagram states that it represents 26 equations and 9 bridges.
### Components/Axes
* **Central Node:** "K" – positioned at the center of the diagram.
* **Radial Lines:** Connecting "K" to various physics concepts.
* **Concept Nodes:** Representing different physics concepts, each with an associated equation.
* **Legend (Top-Right):**
* Red: Atomic and Nuclear (1)
* Orange: Condensed Matter (1)
* Yellow: Electromagnetism (2)
* Green: Quantum Mechanics (3)
* Blue: Statistical Mechanics (4)
* Purple: Thermodynamics (4)
* **Title (Top-Center):** "Physics Concept Network: “K” Domain"
* **Subtitle (Below Title):** "(26 equations, 9 bridges)"
### Detailed Analysis / Content Details
The diagram shows the following concepts connected to "K":
1. **Root Mean Square Speed (Red):** `v_rms = √(3kT/m)`
2. **de Broglie Wavelength (Green):** `π / sqrt(2 * m * E_k)`
3. **Fermi-Dirac (Green):** (Text only, no equation)
4. **Mean Kinetic Energy (Green):** `(E_k) = (3/2)kT`
5. **Wave Equation (Green):** `A * sin(kx - ωt)`
6. **Harmonic Oscillator (Green):** (Text only, no equation)
7. **Band Gap (Orange):** `k*T * ln(N_c*N_v / n)`
8. **Debye Length (Red):** `sqrt(ε_0*k*T / (4*π*n*e^2))`
9. **Superconductivity (Orange):** `3.5 * k * T_c`
10. **Debye Length (Red):** `sqrt(k*T / (4*π*n*e^2))`
11. **Average Speed (Blue):** `(v) = √(8kT/πm)`
12. **Maxwell Distribution (Blue):** `sqrt(8*k*T / (π*m))`
13. **Fine Structure (Yellow):** `1 / (exp(E/(k*T)) - k * e^2 / (h * c))`
14. **Bose-Einstein… (Blue):** (Text only, no equation)
15. **Bose-Einstein… (Blue):** (Text only, no equation)
The lines connecting the concepts to "K" are all approximately the same length, suggesting equal importance or a similar degree of relationship to "K". The color coding indicates the domain of physics each concept belongs to.
### Key Observations
* Quantum Mechanics (Green) has the most connections (3), indicating a strong relationship between "K" and concepts within this domain.
* Statistical Mechanics (Blue) and Thermodynamics (Purple) each have 4 connections.
* Atomic and Nuclear (Red) and Condensed Matter (Orange) have the fewest connections (1 each).
* Several concepts only have a textual label and no equation is provided.
* The diagram uses "…" to indicate that the concept name is truncated.
### Interpretation
This diagram illustrates the central role of the variable "K" (likely Boltzmann constant or a related parameter) in connecting various areas of physics. The network structure suggests that "K" is a fundamental constant that appears in equations across different disciplines. The varying number of connections per domain highlights the relative importance of "K" within those fields. The presence of both equations and textual labels suggests a mix of well-defined quantitative relationships and more conceptual connections. The diagram serves as a visual map of how different physics concepts are interrelated through the common parameter "K". The truncation of some concept names ("Bose-Einstein…") suggests that the diagram is a simplified representation of a more complex network. The number of equations and bridges (26 and 9 respectively) provides a quantitative measure of the network's complexity.