## Confusion Matrix: Label vs Prediction
### Overview
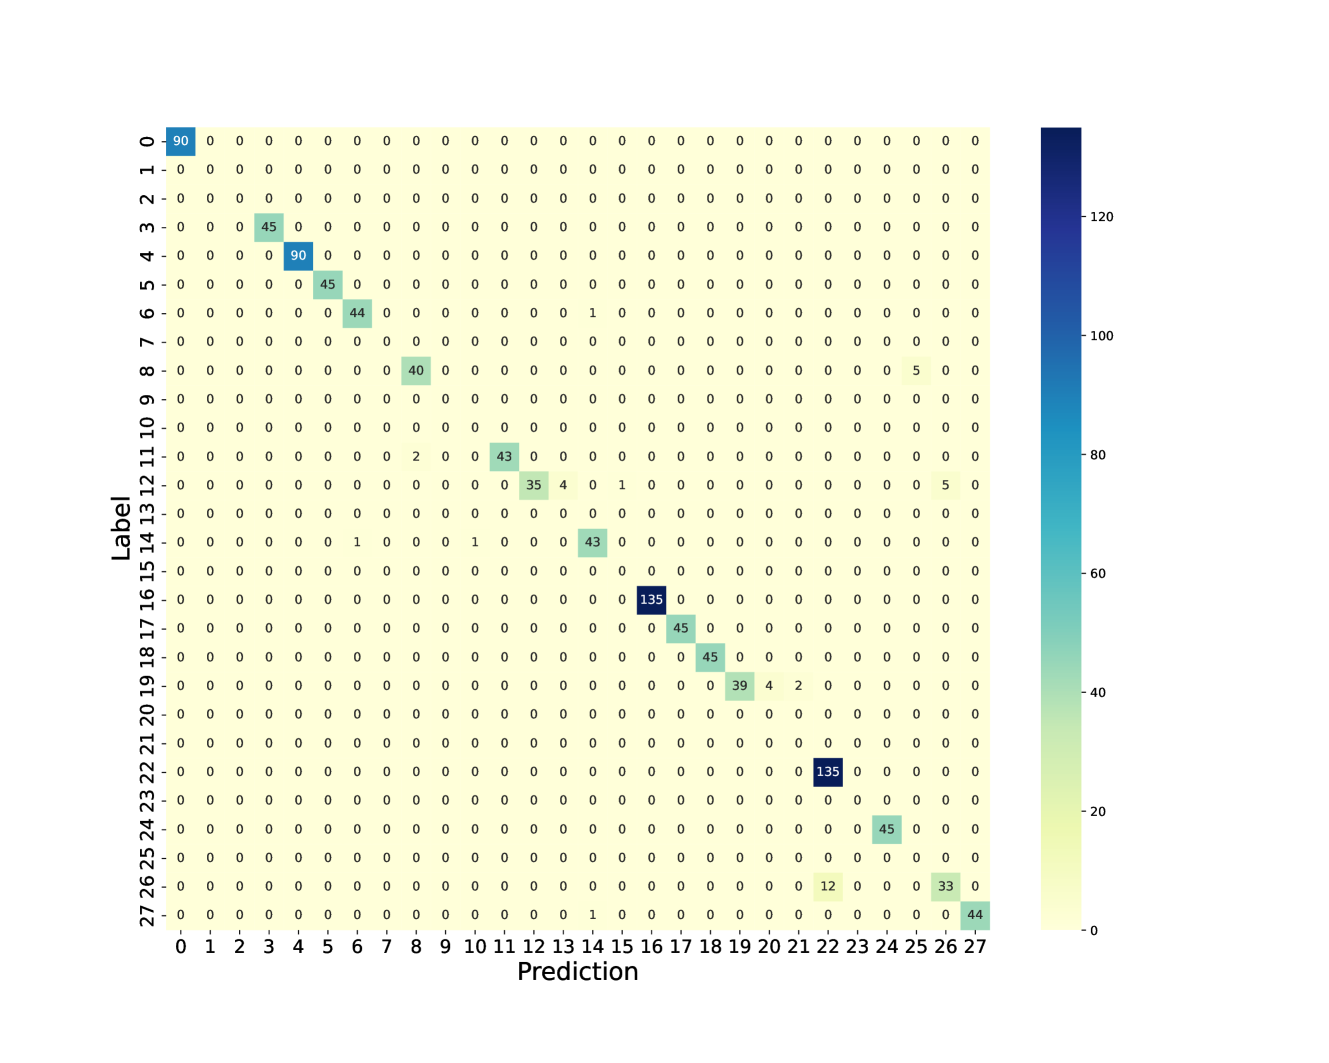
The image is a confusion matrix, visually represented as a heatmap. It displays the performance of a classification model by showing the counts of true positive, true negative, false positive, and false negative predictions for each class. The matrix has "Label" on the y-axis and "Prediction" on the x-axis, both ranging from 0 to 27. The color intensity of each cell corresponds to the number of instances, with darker colors indicating higher counts. A color bar on the right provides a scale for the counts.
### Components/Axes
* **X-axis:** Prediction, with labels from 0 to 27.
* **Y-axis:** Label, with labels from 0 to 27.
* **Color Bar:** Ranges from 0 to approximately 135, with a color gradient from light yellow to dark blue.
* **Labels:** "Label" (y-axis), "Prediction" (x-axis).
### Detailed Analysis
The matrix is a 28x28 grid. Each cell (i, j) represents the number of times an instance of class i (label) was predicted as class j.
Here's a breakdown of the values:
* **Diagonal (True Positives):**
* (0, 0): 90
* (4, 4): 90
* (16, 16): 135
* (22, 22): 135
* (27, 27): 44
* (3, 3): 45
* (5, 5): 45
* (6, 6): 44
* (8, 8): 40
* (11, 11): 43
* (12, 12): 35
* (17, 17): 45
* (18, 18): 45
* (19, 19): 39
* (26, 26): 33
* **Off-Diagonal (Errors):**
* (10, 11): 43
* (19, 20): 4
* (19, 21): 2
* (12, 13): 4
* (24, 25): 45
* (7, 25): 5
* (9, 25): 5
* (11, 13): 4
* (14, 15): 43
* (15, 16): 43
* (26, 27): 12
* (6, 15): 1
All other cells appear to have a value of 0.
### Key Observations
* The diagonal elements have non-zero values, indicating correct classifications.
* The model performs well for classes 0, 4, 16, and 22, with high counts on the diagonal.
* There are some misclassifications, as indicated by the off-diagonal elements. For example, class 10 is often misclassified as class 11.
* Most of the off-diagonal elements are zero, indicating that the model rarely confuses most of the classes.
### Interpretation
The confusion matrix provides a detailed view of the classification model's performance. The high values along the diagonal suggest that the model is generally accurate. However, the off-diagonal elements reveal specific areas where the model struggles. For instance, the confusion between classes 10 and 11 indicates that these classes may have similar features or that the model needs further refinement to distinguish between them. The matrix can be used to identify which classes are most often confused and to guide efforts to improve the model's accuracy. The model seems to perform well on classes 0, 4, 16, and 22, while other classes have lower accuracy.