## Confusion Matrix: Model Performance Evaluation
### Overview
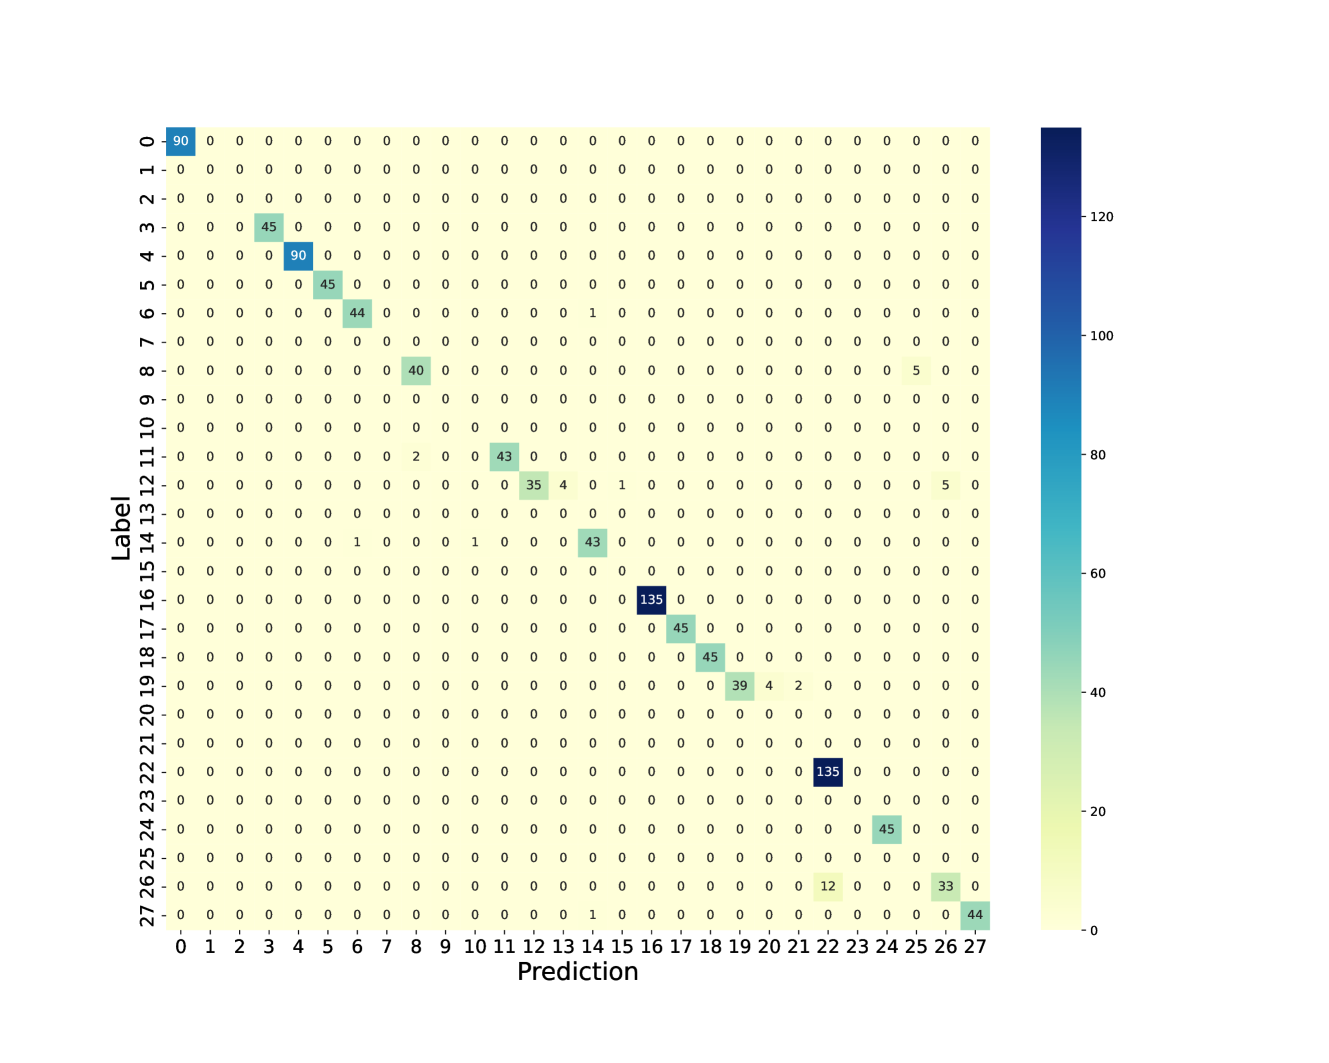
The image displays a confusion matrix, a visualization tool used to evaluate the performance of a classification model. It shows the counts of true positive, true negative, false positive, and false negative predictions for each class. The matrix is presented as a heatmap, where the intensity of the color in each cell corresponds to the number of instances. The rows represent the true labels, and the columns represent the predicted labels.
### Components/Axes
* **Chart Type**: Heatmap (Confusion Matrix)
* **X-axis Title**: Prediction
* **Y-axis Title**: Label
* **Axis Markers (X and Y)**: Both axes are labeled with integers from 0 to 27, representing the different classes.
* **Colorbar**: A vertical colorbar is present on the right side of the matrix.
* **Colorbar Range**: The colorbar ranges from 0 to 120.
* **Colorbar Ticks**: Ticks are present at 0, 20, 40, 60, 80, 100, and 120.
* **Color Mapping**: The color scheme transitions from a light yellow (low values) through light green and teal to dark blue (high values). This indicates that darker colors represent higher counts.
### Detailed Analysis or Content Details
The confusion matrix is a 28x28 grid, with both the 'Label' (true class) and 'Prediction' (predicted class) axes ranging from 0 to 27. The cells contain numerical values representing the count of instances.
**Key non-zero entries and their corresponding (Label, Prediction) coordinates:**
| Label | Prediction | Count |
| :---- | :--------- | :---- |
| 0 | 0 | 90 |
| 2 | 2 | 45 |
| 4 | 4 | 90 |
| 5 | 5 | 45 |
| 6 | 6 | 44 |
| 8 | 8 | 40 |
| 11 | 11 | 2 |
| 12 | 12 | 43 |
| 13 | 13 | 35 |
| 13 | 14 | 4 |
| 13 | 15 | 1 |
| 14 | 14 | 43 |
| 14 | 16 | 5 |
| 15 | 15 | 1 |
| 16 | 16 | 135 |
| 17 | 17 | 45 |
| 19 | 19 | 39 |
| 19 | 20 | 4 |
| 19 | 21 | 2 |
| 22 | 22 | 135 |
| 23 | 23 | 45 |
| 24 | 24 | 45 |
| 25 | 25 | 12 |
| 25 | 26 | 33 |
| 26 | 26 | 44 |
**Observations on Off-Diagonal Entries (Misclassifications):**
* A notable misclassification occurs for Label 13, where 4 instances are predicted as 14 and 1 instance as 15.
* Label 14 has 5 instances misclassified as 16.
* Label 19 shows misclassifications with 4 instances predicted as 20 and 2 instances as 21.
* Label 25 has 33 instances misclassified as 26.
### Key Observations
* **Diagonal Dominance**: The majority of the counts are concentrated along the main diagonal, indicating that the model correctly classifies a significant number of instances for many classes. The highest counts are observed for classes 0, 4, 16, and 22, with values of 90, 90, 135, and 135 respectively.
* **High Accuracy for Certain Classes**: Classes 0, 4, 16, and 22 appear to be well-learned by the model, as evidenced by the high counts on the diagonal.
* **Specific Misclassification Patterns**: There are specific patterns of misclassification. For instance, class 13 is sometimes confused with classes 14 and 15. Class 14 is confused with class 16. Class 19 is confused with classes 20 and 21. Class 25 is frequently confused with class 26.
* **Low Counts for Most Off-Diagonal Cells**: Most off-diagonal cells have very low counts (0, 1, 2, 4, 5), suggesting that the model generally does not confuse most classes with each other.
### Interpretation
This confusion matrix suggests that the classification model performs well overall, with a strong ability to correctly identify instances for many classes, as indicated by the high values on the diagonal. The presence of high counts on the diagonal for classes like 0, 4, 16, and 22 points to robust learning for these specific categories.
However, the off-diagonal entries reveal areas where the model struggles. The specific misclassification patterns observed (e.g., 13 with 14/15, 14 with 16, 19 with 20/21, 25 with 26) suggest that these classes might be visually similar, share common features, or have insufficient distinguishing characteristics in the training data. This could be an opportunity for model improvement by:
1. **Data Augmentation**: Generating more diverse training examples for the confused classes.
2. **Feature Engineering**: Exploring or creating features that better differentiate these classes.
3. **Model Architecture**: Investigating if a different model architecture or fine-tuning existing parameters could improve discrimination.
4. **Class Balancing**: If the dataset is imbalanced, addressing this could help.
The colorbar's scale, ranging up to 120, with the highest values at 135, indicates that the model's performance is generally strong, but there's room for refinement, particularly for the classes exhibiting significant off-diagonal confusion. The Peircean investigative approach would involve further examining the instances that fall into these misclassified categories to understand the underlying reasons for the model's errors, thereby refining the classification process. The relative positioning of the high counts on the diagonal and the scattered, lower counts off-diagonal visually reinforce the interpretation of good general performance with specific weaknesses.