## Heatmap: Prediction vs. Label
### Overview
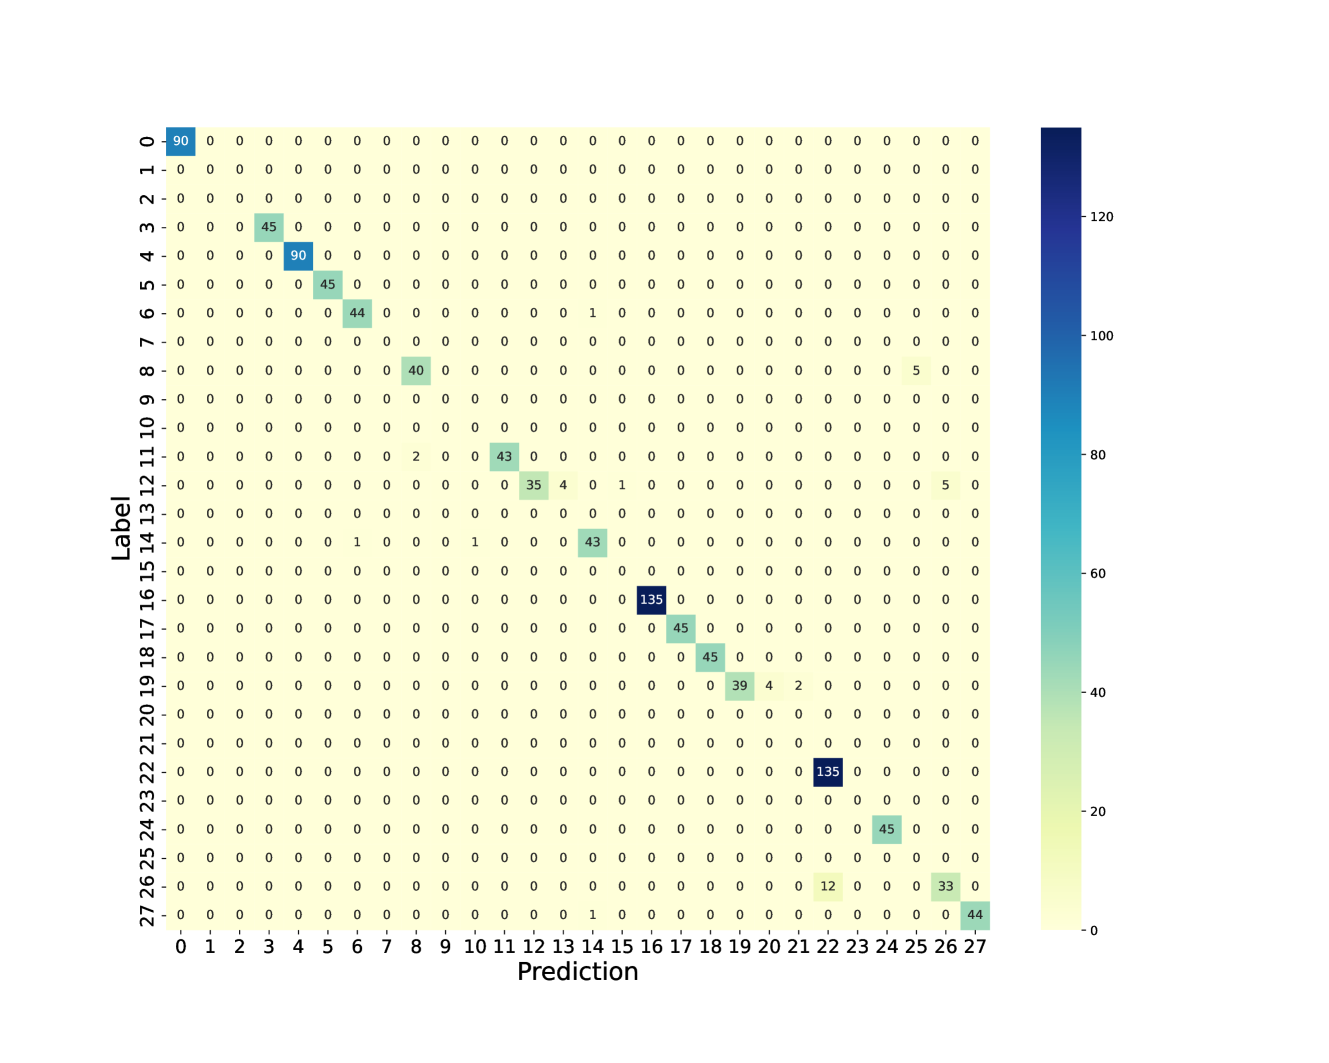
The image presents a heatmap visualizing the relationship between "Prediction" and "Label". The heatmap displays numerical values representing the frequency or count of occurrences for each combination of prediction and label. The color intensity corresponds to the magnitude of the value, with darker blue indicating higher values and lighter blue indicating lower values.
### Components/Axes
* **X-axis:** "Prediction" ranging from 0 to 27, with integer values.
* **Y-axis:** "Label" ranging from 2 to 27, with integer values.
* **Color Scale:** A gradient from light blue to dark blue, representing values from approximately 0 to 135. The scale is positioned on the right side of the heatmap.
* 0: Light Blue
* ~20: Medium Blue
* ~60: Darker Blue
* ~100: Very Dark Blue
* ~120: Deepest Blue
* **Data Points:** Each cell in the heatmap represents a specific (Prediction, Label) pair and is filled with a color corresponding to its value.
### Detailed Analysis
The heatmap shows a sparse distribution of values, with most cells having a value of 0. Several cells have non-zero values, indicating some correlation between specific predictions and labels.
Here's a breakdown of notable values, cross-referenced with the color scale:
* **Label 2, Prediction 0:** Approximately 90. (Deep Blue)
* **Label 3, Prediction 0:** Approximately 45. (Darker Blue)
* **Label 4, Prediction 0:** Approximately 45. (Darker Blue)
* **Label 5, Prediction 0:** Approximately 44. (Darker Blue)
* **Label 6, Prediction 0:** Approximately 45. (Darker Blue)
* **Label 7, Prediction 0:** Approximately 90. (Deep Blue)
* **Label 8, Prediction 0:** Approximately 40. (Darker Blue)
* **Label 9, Prediction 0:** Approximately 40. (Darker Blue)
* **Label 10, Prediction 0:** Approximately 43. (Darker Blue)
* **Label 11, Prediction 0:** Approximately 35. (Darker Blue)
* **Label 12, Prediction 0:** Approximately 4. (Light Blue)
* **Label 13, Prediction 17:** Approximately 135. (Deepest Blue)
* **Label 14, Prediction 18:** Approximately 45. (Darker Blue)
* **Label 15, Prediction 18:** Approximately 45. (Darker Blue)
* **Label 16, Prediction 19:** Approximately 39. (Darker Blue)
* **Label 17, Prediction 20:** Approximately 2. (Light Blue)
* **Label 18, Prediction 21:** Approximately 135. (Deepest Blue)
* **Label 19, Prediction 22:** Approximately 45. (Darker Blue)
* **Label 20, Prediction 23:** Approximately 45. (Darker Blue)
* **Label 21, Prediction 24:** Approximately 3. (Light Blue)
* **Label 22, Prediction 24:** Approximately 12. (Light Blue)
* **Label 23, Prediction 25:** Approximately 33. (Darker Blue)
* **Label 24, Prediction 26:** Approximately 44. (Darker Blue)
* **Label 25, Prediction 27:** Approximately 44. (Darker Blue)
* **Label 26, Prediction 27:** Approximately 0. (Light Blue)
* **Label 27, Prediction 27:** Approximately 0. (Light Blue)
The majority of the heatmap is filled with 0 values, indicating a lack of prediction-label correspondence for most combinations.
### Key Observations
* The highest values (approximately 135) occur at (Label 13, Prediction 17) and (Label 18, Prediction 21).
* Label 2 shows a relatively high frequency of prediction 0 (approximately 90).
* The heatmap is sparse, suggesting that the prediction and label are often mismatched.
* There is no clear diagonal pattern, indicating that the model doesn't consistently predict the correct label.
### Interpretation
This heatmap likely represents a confusion matrix, commonly used in machine learning to evaluate the performance of a classification model. The "Prediction" axis represents the model's output, and the "Label" axis represents the true class. The values in the heatmap indicate how often the model predicted a particular label given the true label.
The high values at (13, 17) and (18, 21) suggest that the model frequently predicts labels 17 and 21 when the true labels are 13 and 18, respectively. The sparsity of the matrix indicates that the model is often incorrect. The high value for Label 2 and Prediction 0 suggests that the model often predicts 0 for the true label 2.
The lack of a strong diagonal pattern indicates that the model is not performing well and has difficulty accurately classifying the labels. The heatmap provides a visual representation of the model's errors, allowing for identification of specific labels that are frequently misclassified. Further analysis would be needed to understand *why* these misclassifications occur.