# Technical Document Extraction: Heatmap Analysis
## 1. Axis Labels and Markers
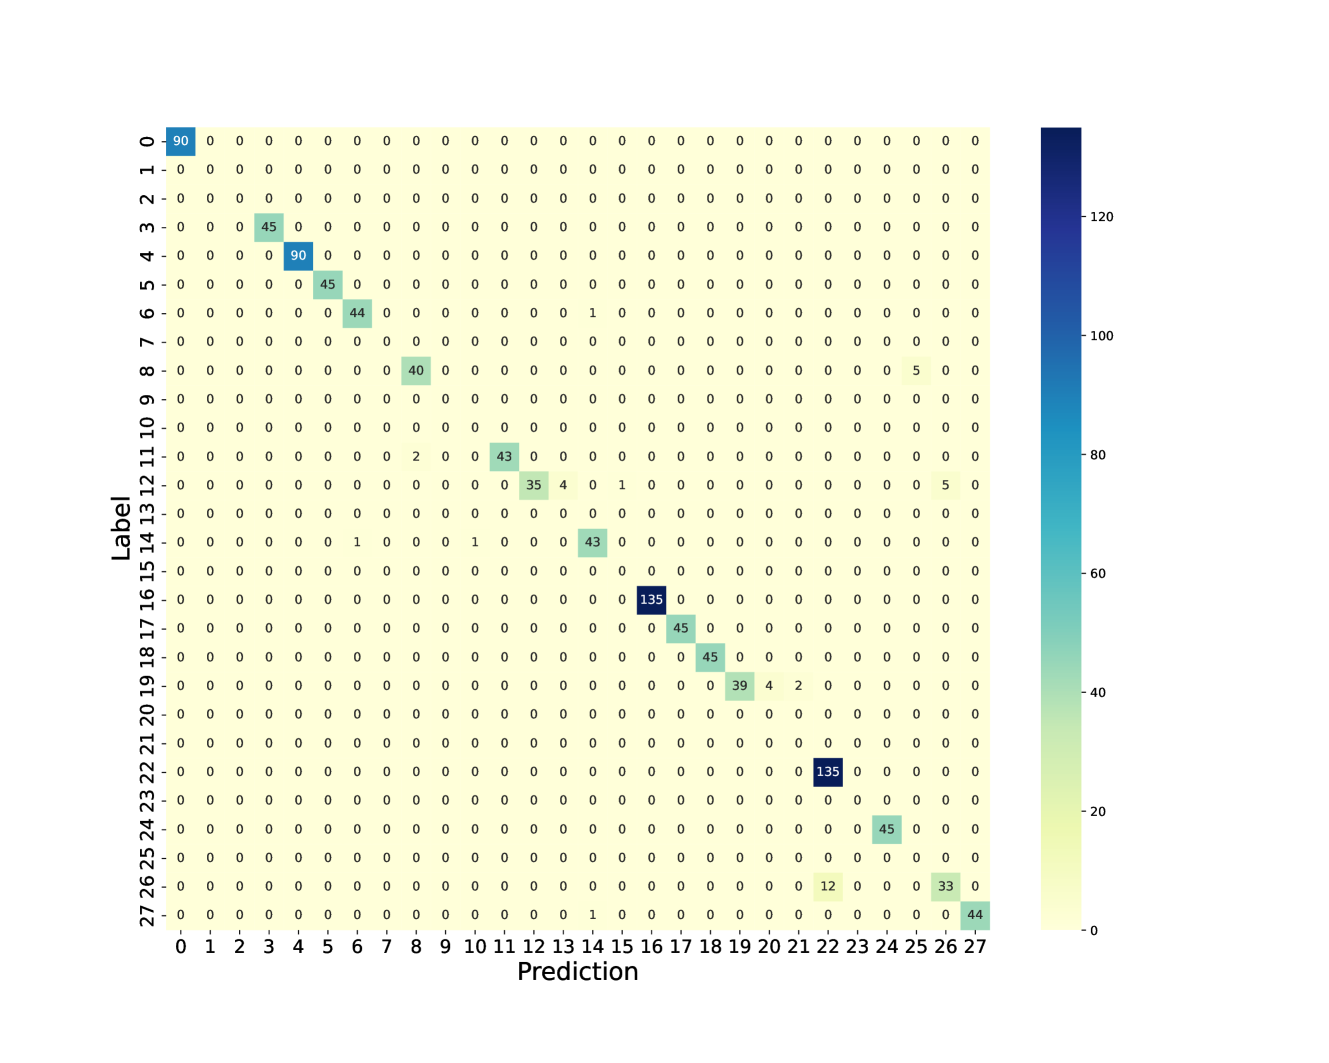
- **X-Axis (Prediction)**: Labeled "Prediction" with integer markers 0–27.
- **Y-Axis (Label)**: Labeled "Label" with integer markers 0–27.
- **Colorbar**: Labeled with values 0–120 (dark blue to yellow gradient).
## 2. Key Data Points and Trends
### Main Diagonal (High Values)
- **(0,0)**: 90 (dark blue)
- **(4,5)**: 90 (dark blue)
- **(15,16)**: 135 (darkest blue)
- **(22,21)**: 135 (darkest blue)
### Off-Diagonal Blocks
- **Top-Left Cluster**:
- **(2,3)**: 45 (light green)
- **(3,4)**: 90 (dark blue)
- **(5,6)**: 45 (light green)
- **(6,7)**: 44 (light green)
- **(7,8)**: 40 (light green)
- **Middle Cluster**:
- **(10,11)**: 43 (light green)
- **(12,13)**: 35 (light green)
- **(13,14)**: 4 (yellow)
- **(14,15)**: 1 (yellow)
- **(16,17)**: 135 (darkest blue)
- **(17,18)**: 45 (light green)
- **(18,19)**: 45 (light green)
- **(19,20)**: 39 (light green)
- **(20,21)**: 4 (yellow)
- **(21,22)**: 2 (yellow)
- **Bottom-Right Cluster**:
- **(23,24)**: 45 (light green)
- **(24,25)**: 12 (yellow)
- **(25,26)**: 33 (light green)
- **(26,27)**: 44 (light green)
- **(27,15)**: 1 (yellow)
- **(27,26)**: 44 (light green)
## 3. Color Legend Verification
- **Dark Blue (120–135)**: Matches highest values (e.g., 135 at (15,16)).
- **Light Green (40–45)**: Matches mid-range values (e.g., 45 at (2,3)).
- **Yellow (0–12)**: Matches lowest values (e.g., 1 at (27,15)).
## 4. Spatial Grounding
- **Legend Position**: Right side of the heatmap (colorbar).
- **Color Consistency**: All data points match the colorbar gradient (e.g., 90 ≈ dark blue, 45 ≈ light green).
## 5. Trend Verification
- **Primary Trend**: Strong diagonal dominance (correct predictions) with values peaking at 135.
- **Secondary Trends**: Off-diagonal clusters indicate misclassifications (e.g., Label 4 frequently predicts 5 with 90).
- **Edge Cases**: Low values (1–4) appear in sparse regions (e.g., (27,15), (13,14)).
## 6. Component Isolation
- **Header**: No explicit header text.
- **Main Chart**: 28x28 heatmap with labeled axes.
- **Footer**: Colorbar (0–120) on the right.
## 7. Transcribed Text
- **Axis Titles**: "Label" (Y), "Prediction" (X).
- **Colorbar Label**: Numerical scale 0–120.
- **Embedded Text**: All numerical values in cells (e.g., 90, 45, 135).
## 8. Missing Information
- No textual annotations beyond axis labels, colorbar, and embedded values.
- No explicit title or contextual description provided in the image.