## Flowchart: Insurance Claim Evaluation Process
### Overview
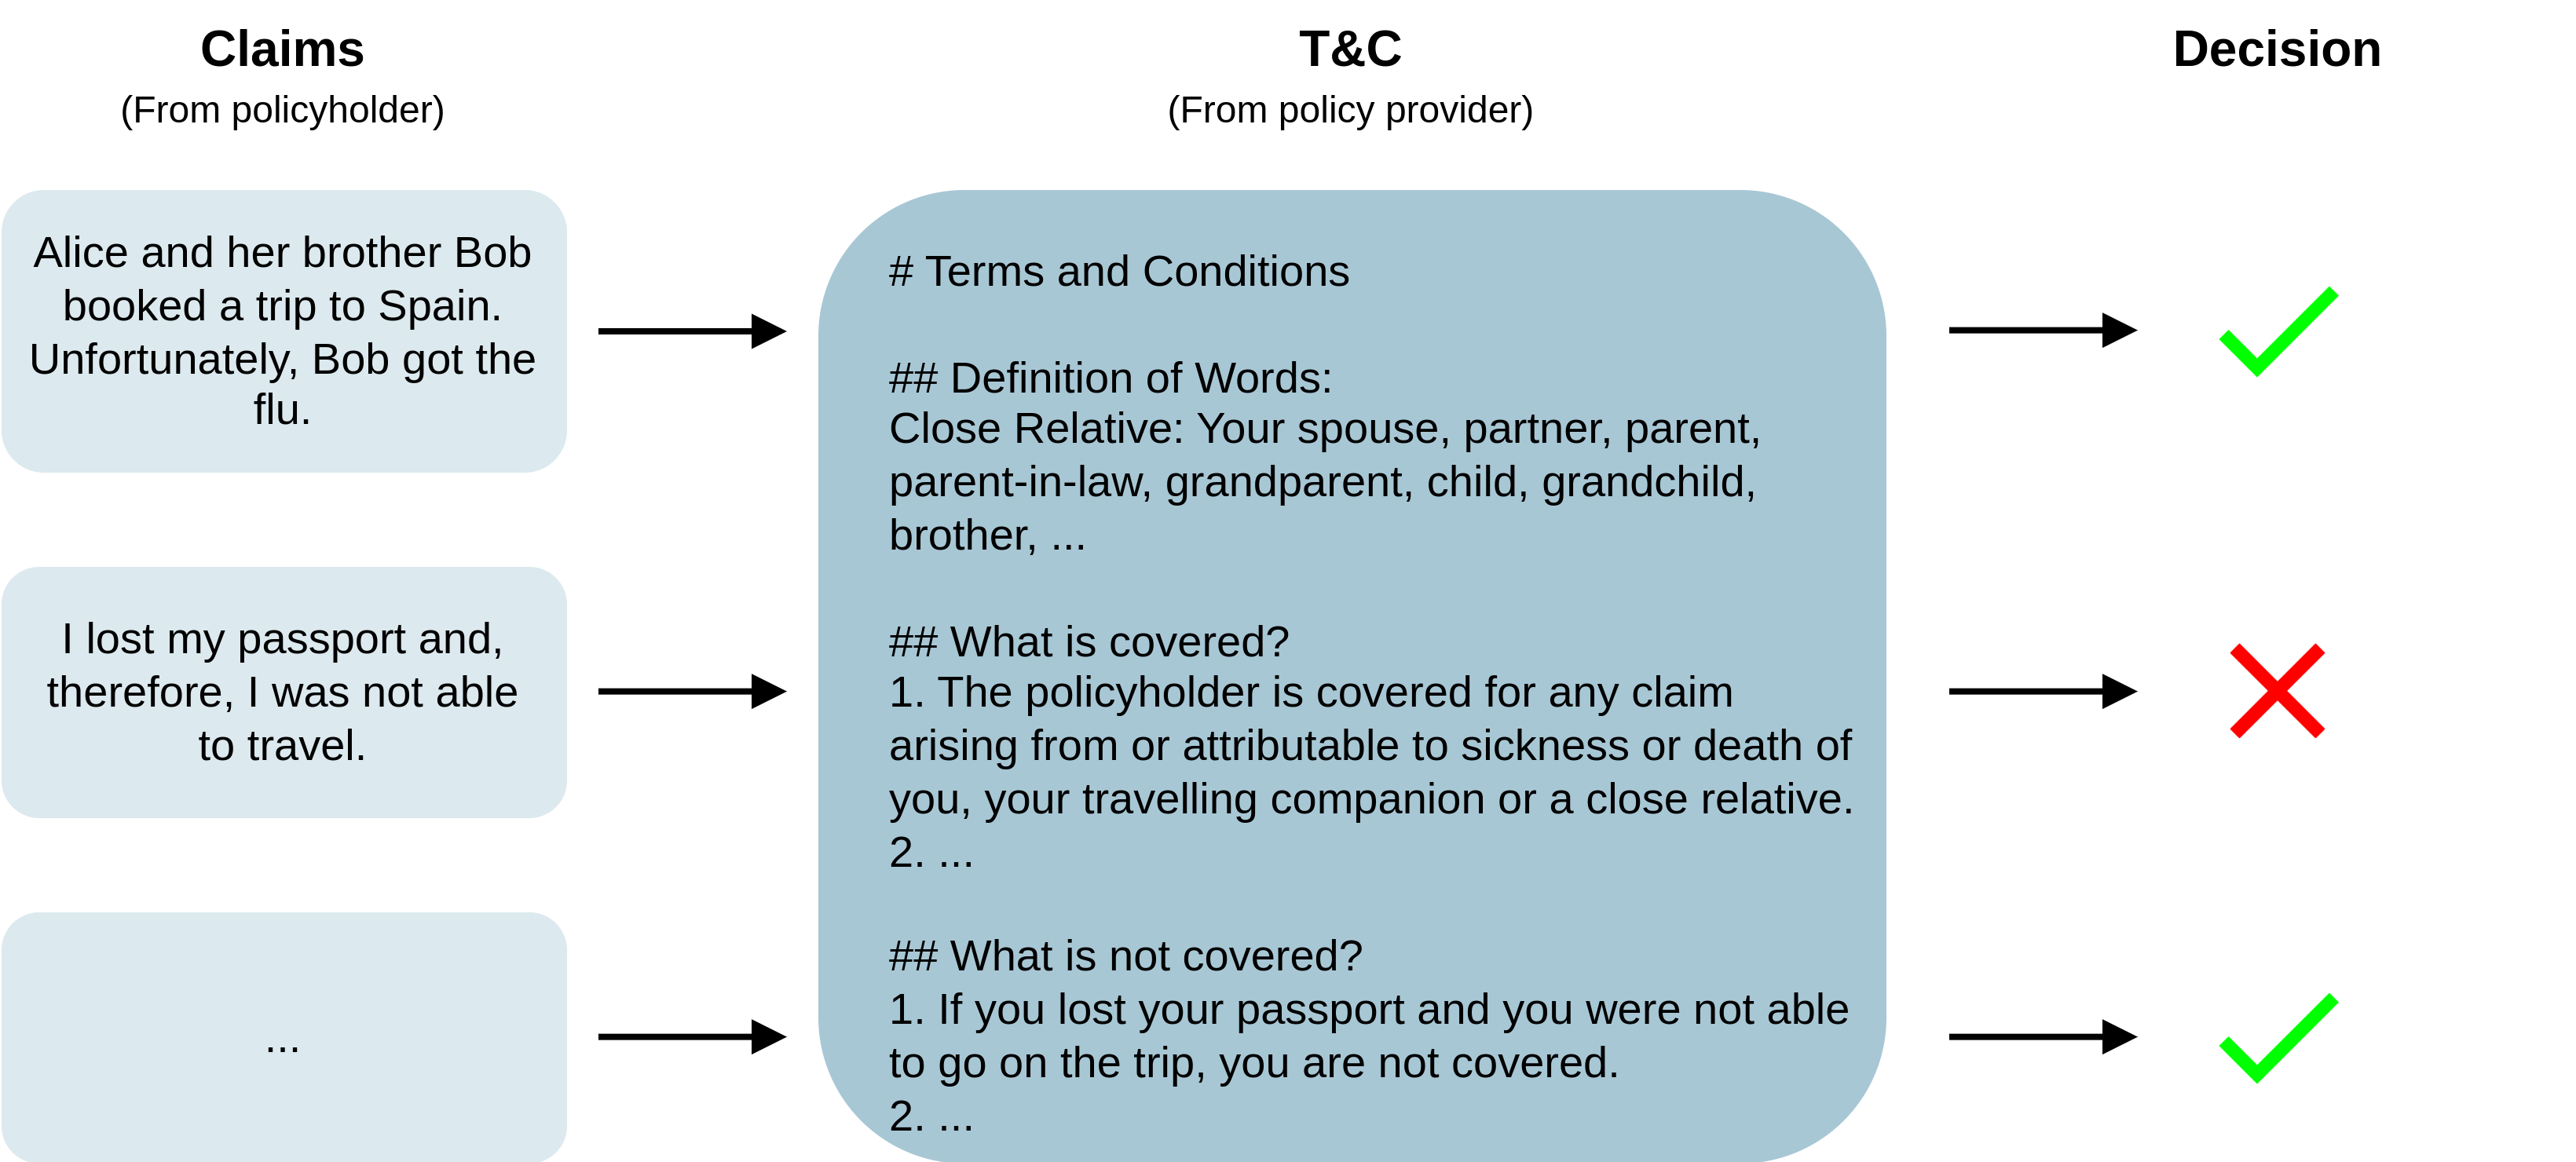
The image depicts a decision-making flowchart for evaluating insurance claims. It consists of three main sections: **Claims** (policyholder submissions), **T&C** (policy terms and conditions), and **Decision** (approval/rejection outcomes). Arrows indicate the flow from claims to T&C analysis to final decisions.
### Components/Axes
1. **Claims Section**
- Labels:
- "Claims (From policyholder)"
- Three claim examples:
1. "Alice and her brother Bob booked a trip to Spain. Unfortunately, Bob got the flu."
2. "I lost my passport and, therefore, I was not able to travel."
3. "..." (ellipsis, indicating additional claims)
- Arrows: Black arrows point from each claim to the T&C section.
2. **T&C Section**
- Labels:
- "T&C (From policy provider)"
- Subsections:
- **# Terms and Conditions**
- **## Definition of Words**:
"Close Relative: Your spouse, partner, parent, parent-in-law, grandparent, child, grandchild, brother, ..."
- **## What is covered?**:
"1. The policyholder is covered for any claim arising from or attributable to sickness or death of you, your travelling companion or a close relative. 2. ..."
- **## What is not covered?**:
"1. If you lost your passport and you were not able to go on the trip, you are not covered. 2. ..."
- Arrows: Black arrows connect the T&C section to the Decision section.
3. **Decision Section**
- Labels:
- "Decision"
- Symbols:
- Green checkmark (✅)
- Red X (❌)
- Arrows: Black arrows connect the T&C section to the Decision section.
### Detailed Analysis
- **Claims**:
- Claim 1: Involves a policyholder’s sibling (Bob) falling ill during a trip.
- Claim 2: Involves a policyholder losing their passport and being unable to travel.
- Claim 3: Placeholder for additional claims (ellipsis).
- **T&C Definitions**:
- "Close Relative" explicitly includes family members (spouse, parent, child, etc.) and in-laws.
- **Coverage Rules**:
- **Covered**: Sickness/death of the policyholder, traveling companion, or close relative.
- **Not Covered**: Lost passport preventing travel (explicitly excluded).
- **Decisions**:
- Claim 1 (Bob’s flu): ✅ Approved (sickness of a close relative).
- Claim 2 (lost passport): ❌ Rejected (explicitly excluded).
- Claim 3: ✅ Approved (assumed alignment with covered scenarios).
### Key Observations
1. **Explicit Exclusion**: Passport loss is directly excluded from coverage, overriding other factors.
2. **Close Relative Coverage**: Sickness/death of family members (e.g., siblings) qualifies for claims.
3. **Ambiguity in Claim 3**: The ellipsis suggests additional claims, but outcomes depend on alignment with T&C rules.
### Interpretation
The flowchart demonstrates a rule-based evaluation system where decisions hinge on strict adherence to T&C definitions. For example:
- **Claim 1** is approved because Bob (a close relative) fell ill, satisfying the "sickness of a close relative" clause.
- **Claim 2** is rejected because passport loss is explicitly excluded, even if it prevents travel.
- **Claim 3**’s approval implies it aligns with covered scenarios (e.g., another close relative’s illness).
The system prioritizes literal interpretation of T&C, leaving no room for subjective judgment. This structure ensures consistency but may disadvantage policyholders in edge cases (e.g., non-listed relatives or unforeseen circumstances).