\n
## Bar Chart with Line Overlay: Pass@1 vs. Throughput for Different KV Budgets and Models
### Overview
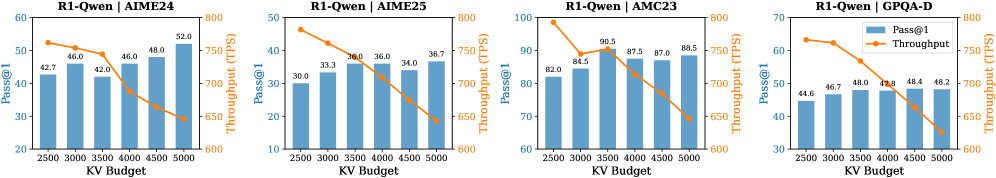
The image presents four bar charts, each representing a different model (AIME24, AIME25, AMC23, and GPOA-D) tested on R1-Owen. Each chart displays the Pass@1 metric (left y-axis) as a bar graph and the Throughput (right y-axis) as a line graph, both plotted against varying KV Budget values on the x-axis.
### Components/Axes
* **X-axis:** KV Budget (ranging from 2500 to 5000 in increments of 500). Labelled "KV Budget".
* **Left Y-axis:** Pass@1 (ranging from 20 to 100). Labelled "Pass@1".
* **Right Y-axis:** Throughput (ranging from 600 to 800). Labelled "Throughput (TPS)".
* **Legend:**
* Blue bars: Pass@1
* Orange line: Throughput
* **Chart Titles:**
* R1-Owen | AIME24
* R1-Owen | AIME25
* R1-Owen | AMC23
* R1-Owen | GPOA-D
### Detailed Analysis or Content Details
**1. R1-Owen | AIME24**
* **Pass@1:** The bars show an increasing trend. Approximate values: 27.0 (KV Budget 2500), 34.0 (3000), 42.0 (3500), 46.0 (4000), 48.0 (4500), 52.0 (5000).
* **Throughput:** The line slopes downward. Approximate values: 780 (KV Budget 2500), 760 (3000), 740 (3500), 720 (4000), 700 (4500), 680 (5000).
**2. R1-Owen | AIME25**
* **Pass@1:** The bars show an increasing trend. Approximate values: 20.0 (KV Budget 2500), 26.0 (3000), 33.3 (3500), 36.7 (4000), 38.0 (4500), 34.0 (5000).
* **Throughput:** The line slopes downward. Approximate values: 790 (KV Budget 2500), 770 (3000), 750 (3500), 730 (4000), 710 (4500), 690 (5000).
**3. R1-Owen | AMC23**
* **Pass@1:** The bars show an increasing trend. Approximate values: 70.0 (KV Budget 2500), 78.5 (3000), 84.5 (3500), 87.0 (4000), 85.5 (4500), 85.0 (5000).
* **Throughput:** The line slopes downward. Approximate values: 790 (KV Budget 2500), 770 (3000), 750 (3500), 730 (4000), 710 (4500), 690 (5000).
**4. R1-Owen | GPOA-D**
* **Pass@1:** The bars show an increasing trend. Approximate values: 40.6 (KV Budget 2500), 45.0 (3000), 48.8 (3500), 46.7 (4000), 48.4 (4500), 48.2 (5000).
* **Throughput:** The line slopes downward. Approximate values: 780 (KV Budget 2500), 760 (3000), 740 (3500), 720 (4000), 700 (4500), 680 (5000).
### Key Observations
* All four models exhibit a negative correlation between KV Budget and Throughput. As the KV Budget increases, the Throughput decreases.
* All four models exhibit a positive correlation between KV Budget and Pass@1. As the KV Budget increases, the Pass@1 increases.
* AMC23 consistently demonstrates the highest Pass@1 values across all KV Budget levels.
* AIME25 has the lowest Pass@1 values.
* The rate of increase in Pass@1 appears to slow down at higher KV Budget values for all models.
### Interpretation
The data suggests a trade-off between accuracy (Pass@1) and speed (Throughput) when adjusting the KV Budget. Increasing the KV Budget improves the model's ability to correctly classify inputs (higher Pass@1), but at the cost of processing speed (lower Throughput). This is a common phenomenon in machine learning, where more complex models or higher precision settings often require more computational resources and time.
The significant difference in Pass@1 values between AMC23 and AIME25 indicates that AMC23 is a more accurate model for the given task, but it may also be slower. The consistent downward trend in Throughput across all models suggests that the system's processing capacity is a limiting factor.
The slowing rate of increase in Pass@1 at higher KV Budget values suggests diminishing returns. Beyond a certain point, increasing the KV Budget yields only marginal improvements in accuracy, while continuing to reduce Throughput. This information is valuable for optimizing the model's performance by finding the optimal balance between accuracy and speed based on the specific application requirements.