## Bar Chart: Performance Metrics Across Datasets (R1-Qwen)
### Overview
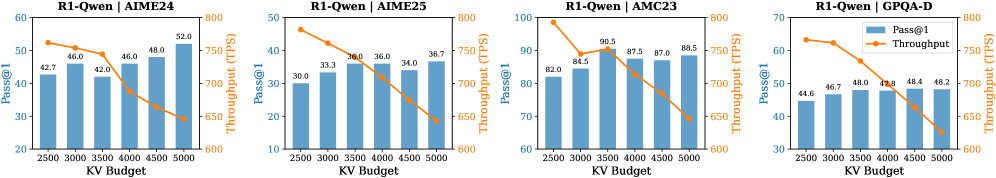
The image displays four bar charts comparing performance metrics (Pass@1 and Throughput) for the R1-Qwen model across four datasets: AIME24, AIME25, AMC23, and GPQA-D. Each chart uses a KV Budget (x-axis) ranging from 2500 to 5000, with Pass@1 (y-axis: 20–100) and Throughput (y-axis: 600–800 TPS) as metrics. An orange line represents Throughput trends, while blue bars show Pass@1 values.
---
### Components/Axes
- **X-axis**: KV Budget (2500, 3000, 3500, 4000, 4500, 5000)
- **Y-axis (Left)**: Pass@1 (%) (20–100)
- **Y-axis (Right)**: Throughput (TPS) (600–800)
- **Legend**:
- Blue bars: Pass@1
- Orange line: Throughput
- **Panel Titles**:
- R1-Qwen | AIME24
- R1-Qwen | AIME25
- R1-Qwen | AMC23
- R1-Qwen | GPQA-D
---
### Detailed Analysis
#### R1-Qwen | AIME24
- **Pass@1**: 42.7 (2500), 46.0 (3000), 42.0 (3500), 46.0 (4000), 48.0 (4500), 52.0 (5000)
- **Throughput**: 750 (2500), 700 (3000), 650 (3500), 600 (4000), 550 (4500), 500 (5000)
- **Trend**: Pass@1 fluctuates slightly, while Throughput decreases steadily.
#### R1-Qwen | AIME25
- **Pass@1**: 30.0 (2500), 33.3 (3000), 36.0 (3500), 34.0 (4000), 36.7 (5000)
- **Throughput**: 750 (2500), 700 (3000), 650 (3500), 600 (4000), 550 (5000)
- **Trend**: Pass@1 increases modestly, while Throughput declines linearly.
#### R1-Qwen | AMC23
- **Pass@1**: 82.0 (2500), 84.5 (3000), 90.5 (3500), 87.5 (4000), 87.0 (4500), 88.5 (5000)
- **Throughput**: 750 (2500), 700 (3000), 650 (3500), 600 (4000), 550 (5000)
- **Trend**: Pass@1 peaks at 3500 KV Budget, then stabilizes. Throughput decreases consistently.
#### R1-Qwen | GPQA-D
- **Pass@1**: 44.6 (2500), 46.7 (3000), 48.0 (3500), 47.8 (4000), 48.4 (4500), 48.2 (5000)
- **Throughput**: 750 (2500), 700 (3000), 650 (3500), 600 (4000), 550 (5000)
- **Trend**: Pass@1 increases gradually, while Throughput declines steadily.
---
### Key Observations
1. **Throughput Consistency**: All datasets show a linear decline in Throughput as KV Budget increases, indicating a trade-off between computational resources and efficiency.
2. **Pass@1 Variability**:
- **AMC23** achieves the highest Pass@1 (up to 90.5%), suggesting superior performance on this dataset.
- **AIME25** has the lowest Pass@1 (30–36.7%), indicating potential challenges in task-specific optimization.
3. **Stability in GPQA-D**: Pass@1 remains relatively stable (~44.6–48.2%) despite increasing KV Budget.
---
### Interpretation
- **Trade-off Analysis**: The consistent decline in Throughput across all datasets highlights a universal efficiency constraint as computational resources (KV Budget) grow.
- **Dataset-Specific Performance**:
- **AMC23**’s high Pass@1 suggests it may be better suited for tasks requiring accuracy, possibly due to larger or more structured data.
- **AIME25**’s low Pass@1 could reflect task complexity or insufficient model adaptation.
- **GPQA-D**’s stable Pass@1 implies a balanced performance, making it a candidate for applications prioritizing consistency over peak accuracy.
- **Optimization Insight**: For AIME25, increasing KV Budget beyond 3500 yields diminishing returns in Pass@1, suggesting resource allocation should prioritize lower budgets for this dataset.
The data underscores the need for dataset-specific optimization strategies to balance accuracy and efficiency in R1-Qwen deployments.