\n
## Diagram: Grid with Numerical Labels
### Overview
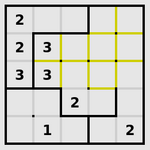
The image depicts a grid composed of rectangular cells, with numerical labels placed within some of the cells. Yellow lines segment the grid into irregular regions. The grid appears to be a 5x5 arrangement, though not all cells are fully defined by the black border.
### Components/Axes
The diagram consists of:
* A 5x5 grid structure defined by a black border.
* Numerical labels: 1, 2, and 3.
* Yellow lines that divide the grid into several irregular regions.
* Small black dots scattered within some of the grid cells.
### Detailed Analysis or Content Details
The numerical labels and their positions within the grid are as follows:
* Top-left cell: "2"
* Second cell in the first row: "2"
* Third cell in the first row: "3"
* First cell in the second row: "3"
* Second cell in the second row: "3"
* Third cell in the second row: "2"
* First cell in the third row: "1"
* Last cell in the third row: "2"
The yellow lines are positioned as follows:
* A vertical line separating the first and second columns.
* A vertical line separating the third and fourth columns.
* A horizontal line separating the first and second rows.
* A horizontal line separating the second and third rows.
* A horizontal line separating the fourth and fifth rows.
The black dots are scattered throughout the grid, with no apparent pattern.
### Key Observations
The numbers 1, 2, and 3 are distributed across the grid. The yellow lines create a partitioning of the grid, potentially defining regions with specific properties. The dots do not appear to be associated with any specific number or region.
### Interpretation
The diagram likely represents a spatial arrangement or a puzzle-like structure. The numbers could represent values, categories, or identifiers associated with each region. The yellow lines might define boundaries or constraints within the grid. Without further context, it's difficult to determine the precise meaning or purpose of the diagram. It could be a simplified representation of a map, a game board, or a data visualization. The dots could be markers or indicators of some kind. The arrangement suggests a problem-solving or optimization task, where the goal might be to arrange or manipulate the numbers within the defined regions.