\n
## Line Chart: Inference Compute Scaling
### Overview
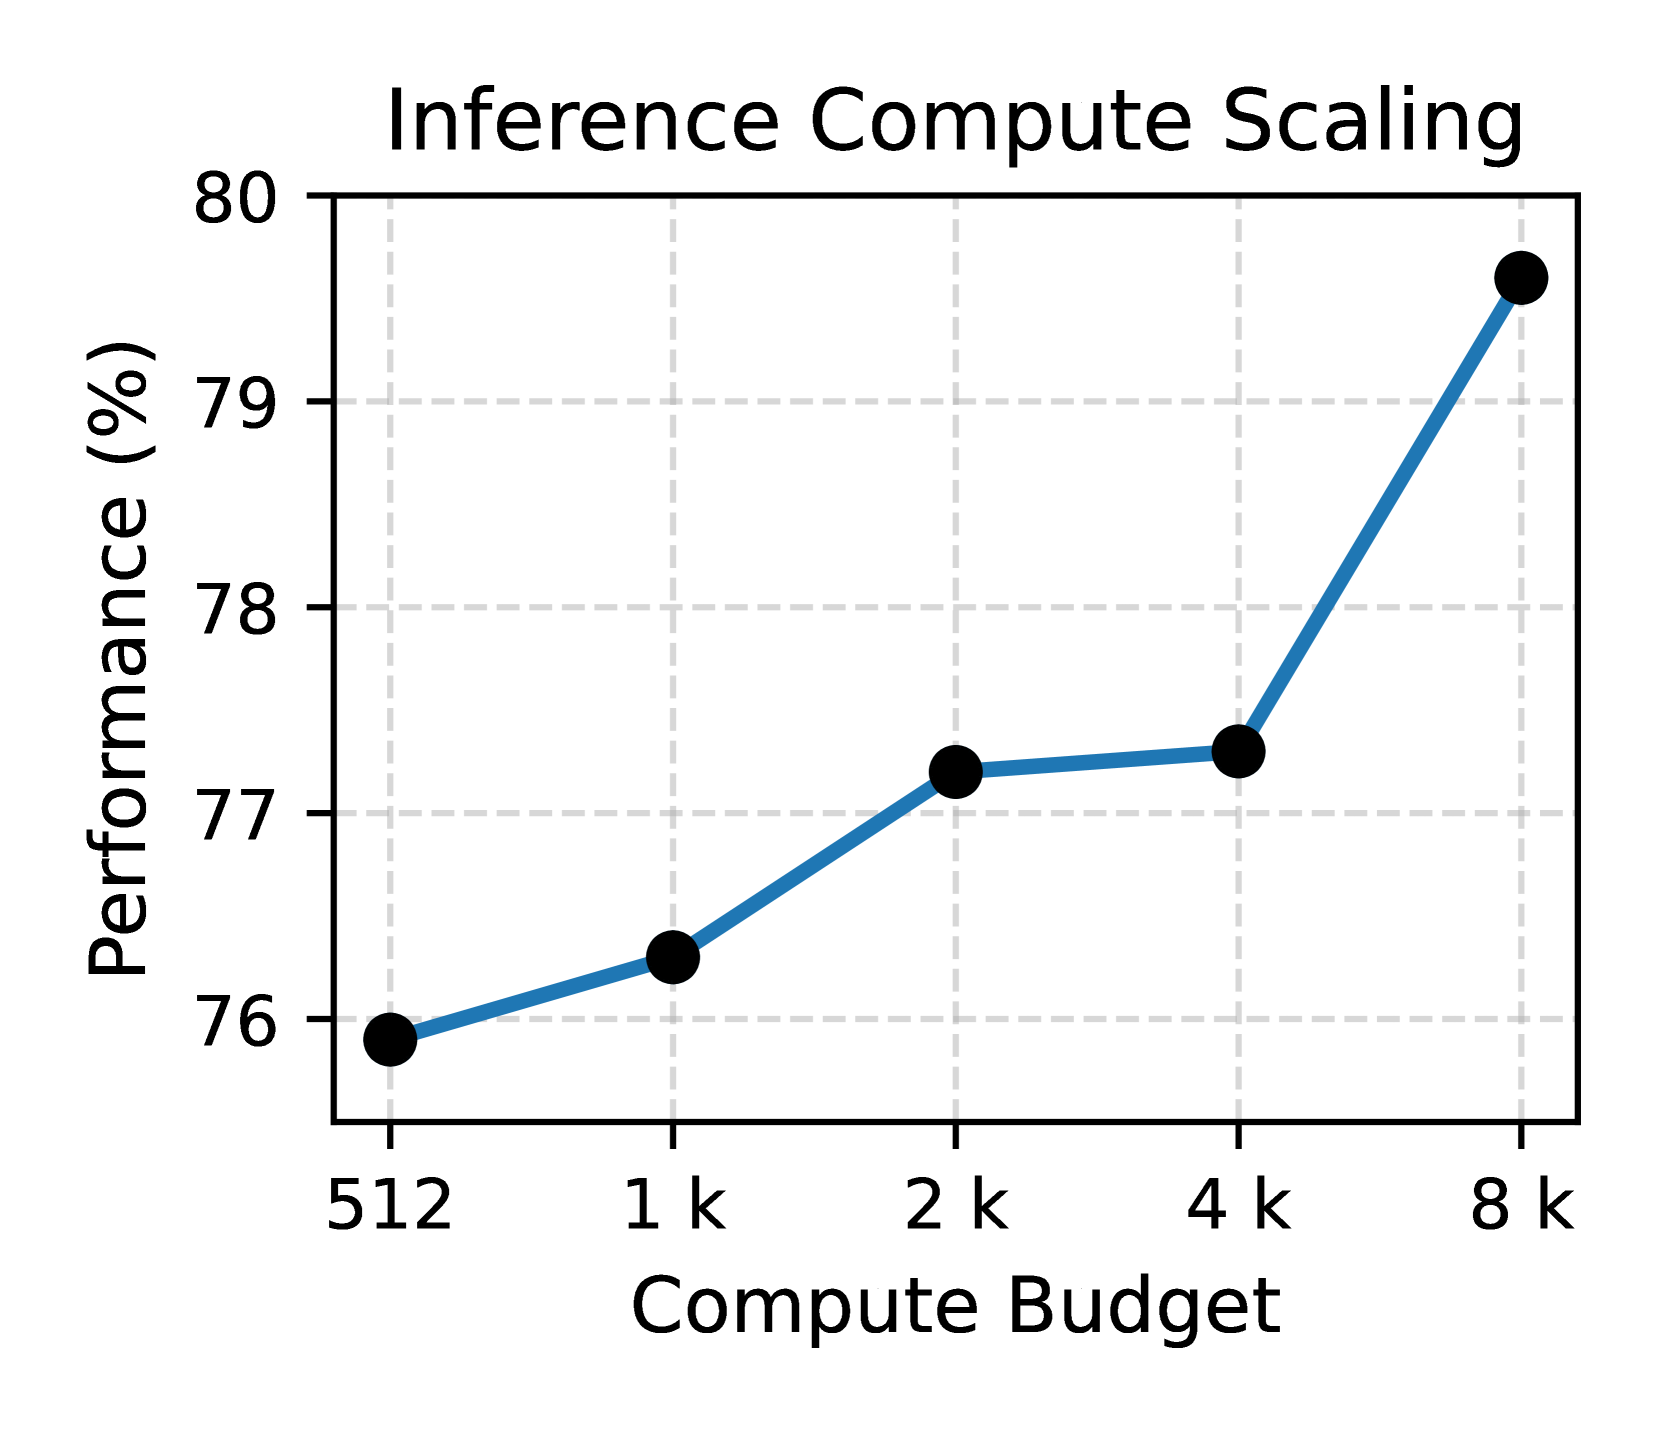
This image presents a line chart illustrating the relationship between "Compute Budget" and "Performance (%)". The chart shows how performance increases with increasing compute budget.
### Components/Axes
* **Title:** "Inference Compute Scaling" - positioned at the top-center of the chart.
* **X-axis:** "Compute Budget" - labeled at the bottom of the chart. The axis has markers at 512, 1k, 2k, 4k, and 8k. "k" likely represents thousands.
* **Y-axis:** "Performance (%)" - labeled on the left side of the chart. The axis ranges from approximately 75.5% to 80%, with gridlines at 76%, 77%, 78%, 79%, and 80%.
* **Data Series:** A single blue line representing the performance scaling.
* **Data Points:** Black circular markers are placed at each compute budget value, indicating the corresponding performance percentage.
### Detailed Analysis
The blue line representing performance generally slopes upward, indicating that performance increases with compute budget. However, the rate of increase is not constant.
* **512 Compute Budget:** Performance is approximately 76.2%.
* **1k Compute Budget:** Performance is approximately 76.5%.
* **2k Compute Budget:** Performance is approximately 77.3%.
* **4k Compute Budget:** Performance is approximately 77.5%.
* **8k Compute Budget:** Performance is approximately 79.8%.
The increase from 512 to 1k is minimal. The increase from 1k to 2k is more significant. The increase from 2k to 4k is minimal. The increase from 4k to 8k is substantial.
### Key Observations
* The most significant performance gains are observed when increasing the compute budget from 4k to 8k.
* There appears to be diminishing returns in performance gains as the compute budget increases from 512 to 2k.
* The performance increase between 1k and 2k is the largest single jump.
### Interpretation
The chart demonstrates a positive correlation between compute budget and inference performance. However, the relationship is not linear. Initially, increasing the compute budget yields small performance improvements. Beyond a certain point (around 4k), increasing the compute budget results in a much more substantial performance gain. This suggests that there may be a threshold where additional compute resources become significantly more effective. The diminishing returns observed at lower compute budgets could be due to factors like algorithmic efficiency or hardware limitations. The steep increase at 8k suggests that the model is becoming compute-bound at lower budgets and benefits significantly from the increased resources. This data is useful for determining the optimal compute budget for a given performance target, balancing cost and efficiency.