## Line Chart: Inference Compute Scaling
### Overview
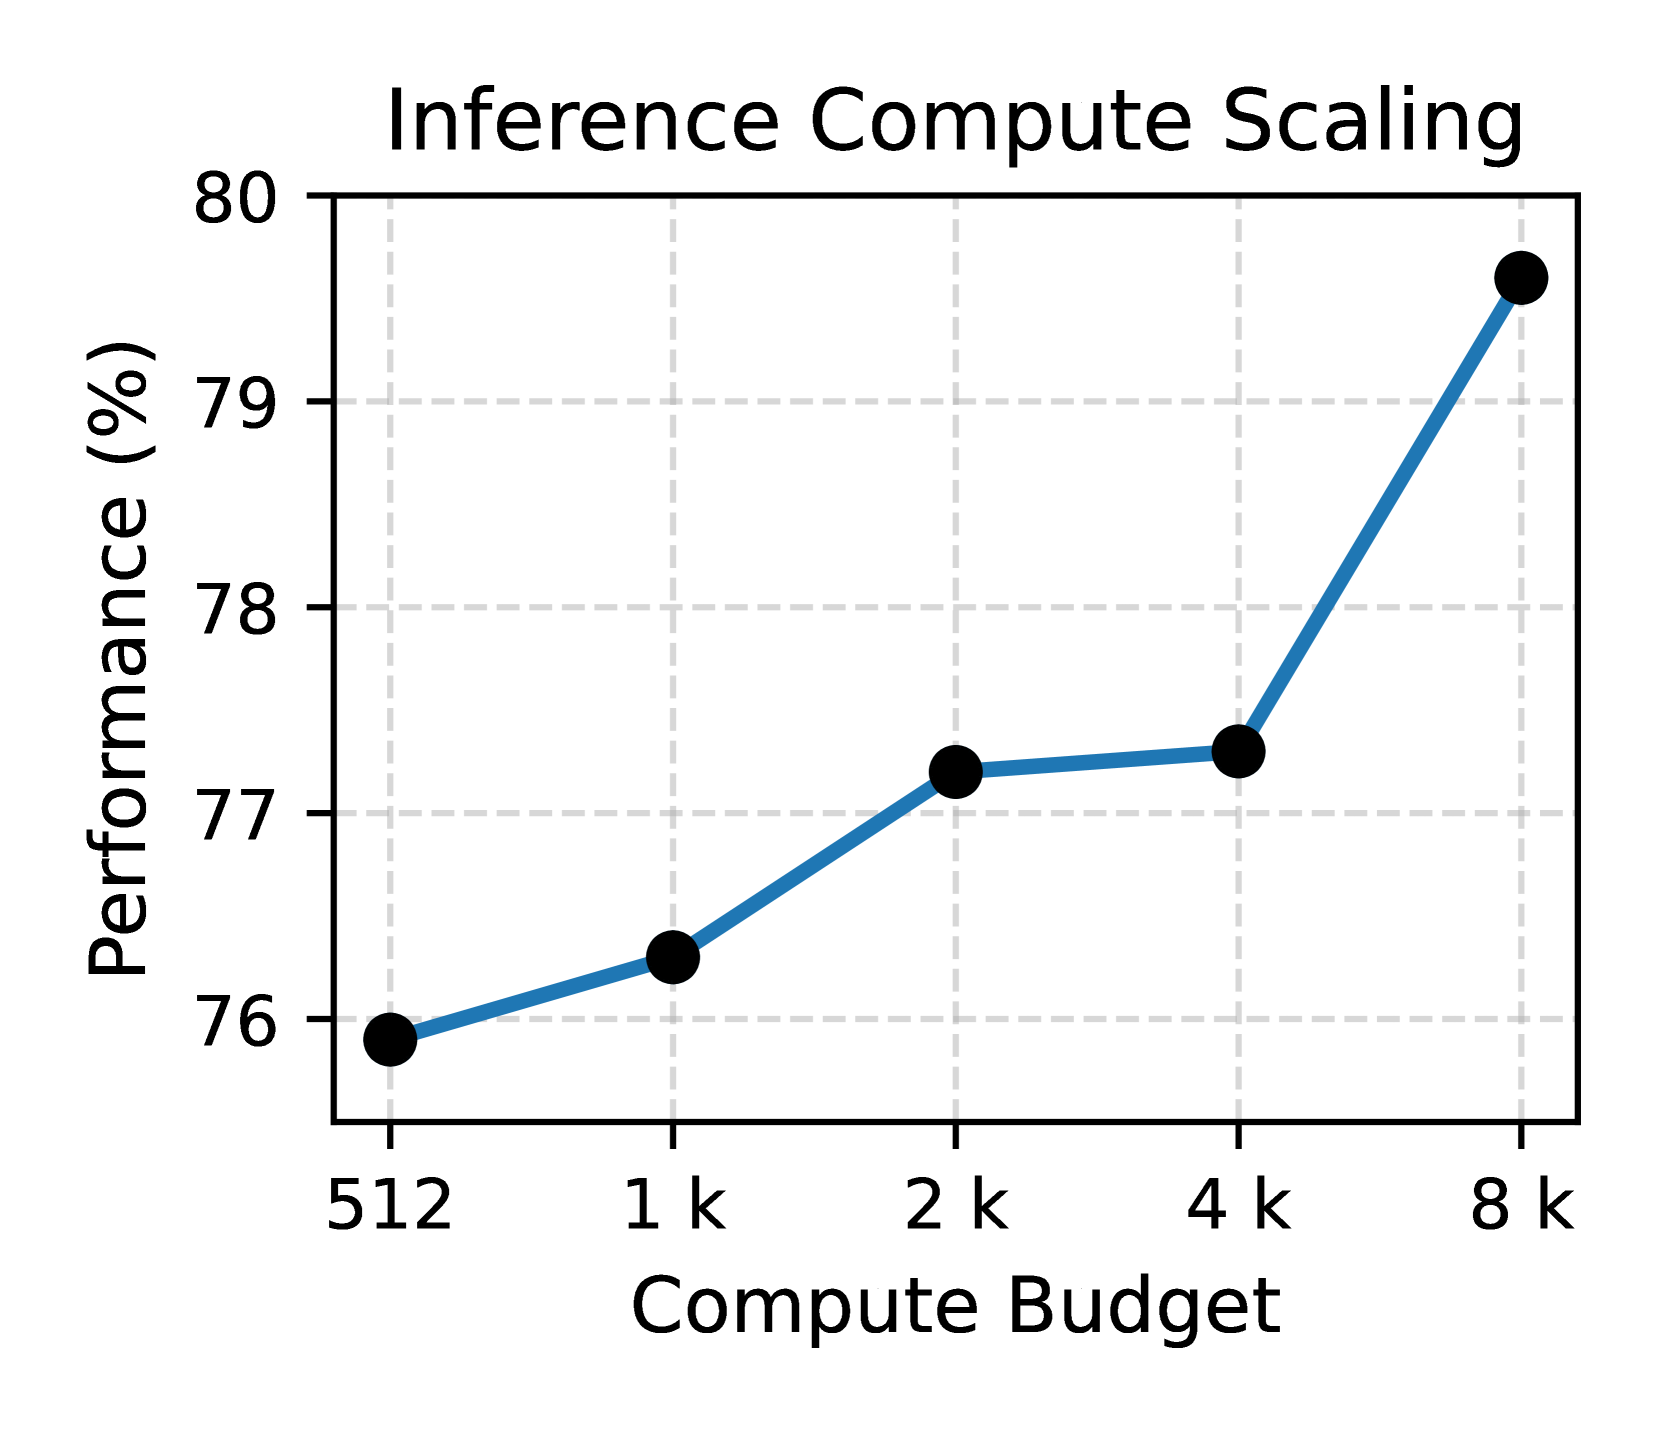
The chart illustrates the relationship between compute budget (x-axis) and performance percentage (y-axis) for an inference compute scaling system. A blue line with black data points shows performance trends across different compute budgets.
### Components/Axes
- **Title**: "Inference Compute Scaling" (top center)
- **X-axis**: "Compute Budget" with values: 512, 1k, 2k, 4k, 8k (logarithmic scale)
- **Y-axis**: "Performance (%)" with values: 76% to 80% (linear scale)
- **Legend**: Located at top-right corner, labeled "Inference Compute Scaling" with a blue line marker
- **Data Points**: Black circles connected by a blue line
### Detailed Analysis
- **Data Points**:
- (512, 76.0%)
- (1k, 76.3%)
- (2k, 77.2%)
- (4k, 77.3%)
- (8k, 79.6%)
- **Trend**:
- Initial gradual increase from 512 to 2k compute budget (76.0% → 77.2%)
- Plateau between 2k and 4k (77.2% → 77.3%)
- Sharp upward spike from 4k to 8k (77.3% → 79.6%)
### Key Observations
1. **Efficiency Gains**: Performance improves significantly at higher compute budgets, particularly between 4k and 8k.
2. **Diminishing Returns**: Minimal improvement between 2k and 4k compute budgets suggests saturation.
3. **Non-linear Scaling**: The sharp increase at 8k indicates potential architectural optimizations or threshold effects.
### Interpretation
The data demonstrates that inference compute scaling exhibits **non-linear performance improvements**, with the most substantial gains occurring at the highest compute budget (8k). The plateau between 2k and 4k suggests diminishing returns in this range, possibly due to hardware limitations or algorithmic bottlenecks. The 8k compute budget achieves a 3.6% performance improvement over 4k, indicating potential for targeted optimizations at higher resource levels. This pattern highlights the importance of balancing compute budget allocation with algorithmic efficiency to maximize performance gains.