## Diagram: Bidirectional Relationship and 3D Geometric Representation
### Overview
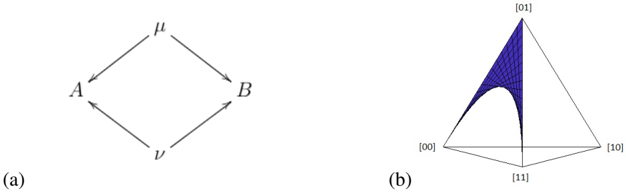
The image contains two distinct diagrams:
- **(a)** A bidirectional diamond-shaped diagram with labeled nodes and directional arrows.
- **(b)** A 3D pyramid-like structure with labeled vertices and a shaded triangular region.
### Components/Axes
#### Diagram (a): Bidirectional Relationship
- **Nodes**:
- Labeled `A` (left) and `B` (right).
- **Arrows**:
- Two bidirectional arrows between `A` and `B`:
- Top arrow labeled `μ` (from `A` to `B`).
- Bottom arrow labeled `ν` (from `B` to `A`).
- **No legend or axis titles** present.
#### Diagram (b): 3D Pyramid
- **Vertices**:
- Labeled with binary coordinates:
- Top vertex: `[01]`
- Bottom-left vertex: `[00]`
- Bottom-right vertex: `[10]`
- Base vertex: `[11]`
- **Axes**:
- No explicit axis titles, but coordinates suggest a 3D Cartesian-like system.
- **Shaded Region**:
- A triangular area shaded in purple, spanning from `[00]` to `[01]` and extending toward the apex `[01]`.
- **Grid Pattern**:
- A grid overlay on the shaded region, suggesting a parametric or functional relationship.
### Detailed Analysis
#### Diagram (a): Bidirectional Relationship
- The diagram represents a system with two states (`A` and `B`) and two transition mechanisms (`μ` and `ν`).
- Arrows indicate reversible interactions: `A` transitions to `B` via `μ`, and `B` transitions back to `A` via `ν`.
#### Diagram (b): 3D Pyramid
- The pyramid’s vertices are labeled with binary coordinates, possibly representing binary states or binary variables.
- The shaded triangular region between `[00]` and `[01]` may indicate a subset of interest, such as a probability distribution or a constrained solution space.
- The grid pattern on the shaded area implies a functional or parametric relationship, though no explicit equation or scale is provided.
### Key Observations
1. **Bidirectional Flow**: Diagram (a) emphasizes symmetry in transitions between `A` and `B`, with equal emphasis on `μ` and `ν`.
2. **Geometric Constraints**: Diagram (b) highlights a specific region (shaded area) within the pyramid, potentially representing a boundary or critical zone.
3. **Lack of Numerical Data**: No explicit values, scales, or legends are provided, limiting quantitative interpretation.
### Interpretation
- **Diagram (a)**: Likely models a dynamic system (e.g., chemical reactions, state transitions) where `μ` and `ν` represent forward and reverse processes. The absence of rates or magnitudes suggests a qualitative rather than quantitative analysis.
- **Diagram (b)**: The 3D pyramid could represent a geometric or probabilistic framework. The shaded region might denote a critical threshold or a region of integration (e.g., in calculus or optimization). The binary coordinates hint at a connection to binary logic, quantum states, or combinatorial systems.
- **Relationship Between Diagrams**: While disconnected visually, both diagrams emphasize directional relationships (`μ`/`ν` in (a), shaded region in (b)) and may belong to a broader system involving state transitions and geometric constraints.
### Limitations
- No numerical data or units are provided, making quantitative analysis impossible.
- The purpose of the shaded region in (b) and the exact nature of `μ`/`ν` in (a) remain ambiguous without additional context.