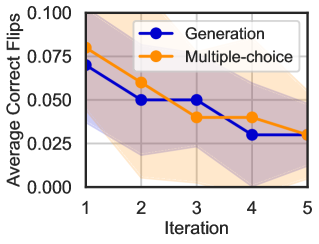
## Chart Type: Line Chart with Error Bands: Average Correct Flips per Iteration
### Overview
This image displays a 2D line chart comparing the "Average Correct Flips" over 5 "Iterations" for two different methods: "Generation" and "Multiple-choice". Each line is accompanied by a shaded band representing uncertainty or a confidence interval.
### Components/Axes
* **Y-axis Label**: "Average Correct Flips"
* Scale: Ranges from 0.000 to 0.100.
* Major Ticks: 0.000, 0.025, 0.050, 0.075, 0.100.
* **X-axis Label**: "Iteration"
* Scale: Ranges from 1 to 5.
* Major Ticks: 1, 2, 3, 4, 5.
* **Legend**: Located in the top-right corner of the plot area.
* **Generation**: Represented by a dark blue line with solid blue circular markers.
* **Multiple-choice**: Represented by an orange line with solid orange circular markers.
### Detailed Analysis
The chart presents two data series, each showing a general downward trend in "Average Correct Flips" as "Iteration" increases. Both lines are accompanied by semi-transparent shaded areas indicating uncertainty around the mean values.
1. **Generation (Dark Blue Line with Blue Circles)**:
* **Visual Trend**: The line generally slopes downwards. It starts at a relatively high value, decreases, plateaus for a couple of iterations, and then decreases again to a final low value.
* **Data Points**:
* Iteration 1: Approximately 0.070
* Iteration 2: Approximately 0.050
* Iteration 3: Approximately 0.050
* Iteration 4: Approximately 0.029
* Iteration 5: Approximately 0.029
* **Uncertainty Band**: A semi-transparent dark blue/purple shaded area surrounds the line, indicating the variability or confidence interval for the "Generation" method. This band appears wider at earlier iterations and narrows towards Iteration 5.
2. **Multiple-choice (Orange Line with Orange Circles)**:
* **Visual Trend**: The line also generally slopes downwards. It starts at the highest value, shows a relatively steep initial decrease, then a more gradual decrease, and finally plateaus at a low value.
* **Data Points**:
* Iteration 1: Approximately 0.080
* Iteration 2: Approximately 0.060
* Iteration 3: Approximately 0.040
* Iteration 4: Approximately 0.040
* Iteration 5: Approximately 0.029
* **Uncertainty Band**: A semi-transparent orange shaded area surrounds the line, indicating the variability or confidence interval for the "Multiple-choice" method. Similar to the "Generation" band, it appears wider at earlier iterations and narrows towards Iteration 5.
### Key Observations
* Both "Generation" and "Multiple-choice" methods show a decrease in "Average Correct Flips" over 5 iterations.
* At Iteration 1, "Multiple-choice" starts with a higher "Average Correct Flips" (~0.080) compared to "Generation" (~0.070).
* "Multiple-choice" exhibits a steeper initial decline from Iteration 1 to Iteration 3.
* "Generation" shows a plateau between Iteration 2 and Iteration 3, maintaining an "Average Correct Flips" of approximately 0.050.
* "Multiple-choice" shows a plateau between Iteration 3 and Iteration 4, maintaining an "Average Correct Flips" of approximately 0.040.
* By Iteration 5, both methods converge to approximately the same "Average Correct Flips" value of about 0.029.
* The uncertainty bands for both methods overlap significantly across most iterations, particularly from Iteration 3 onwards, suggesting that the differences between the two methods might not be statistically significant in these later stages.
### Interpretation
The data suggests that both the "Generation" and "Multiple-choice" methods lead to a reduction in "Average Correct Flips" over successive iterations. This could imply an improvement in performance, a reduction in errors, or a convergence towards a stable state as the process iterates.
Initially, the "Multiple-choice" method appears to have a slightly higher rate of "correct flips," but it also demonstrates a more rapid initial improvement (steeper decline) compared to "Generation." The "Generation" method shows a more gradual reduction, with a period of stagnation in the middle iterations.
Crucially, despite their differing trajectories, both methods achieve a very similar low level of "Average Correct Flips" by the fifth iteration. The substantial overlap in their uncertainty bands, especially in the later iterations, indicates that any observed differences between the two methods might not be statistically robust, particularly as they approach their final performance levels. This implies that for long-term performance (after 5 iterations), both methods might be equally effective in minimizing "correct flips," although "Multiple-choice" might reach a lower error rate faster in the initial stages.