## Line Chart: Average Correct Flips vs. Iteration
### Overview
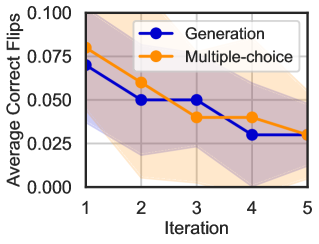
The image is a line chart comparing the average correct flips over iterations for two methods: "Generation" and "Multiple-choice". The chart shows how the performance of each method changes across five iterations. Shaded regions around each line indicate the variability or uncertainty associated with the data.
### Components/Axes
* **X-axis:** Iteration (labeled 1 to 5)
* **Y-axis:** Average Correct Flips (labeled 0.000 to 0.100, incrementing by 0.025)
* **Legend:** Located in the top-right corner.
* Blue line with circles: Generation
* Orange line with circles: Multiple-choice
### Detailed Analysis
* **Generation (Blue):**
* Trend: Generally decreasing over iterations.
* Data Points:
* Iteration 1: Approximately 0.070
* Iteration 2: Approximately 0.050
* Iteration 3: Approximately 0.050
* Iteration 4: Approximately 0.030
* Iteration 5: Approximately 0.030
* **Multiple-choice (Orange):**
* Trend: Decreasing initially, then leveling off.
* Data Points:
* Iteration 1: Approximately 0.080
* Iteration 2: Approximately 0.060
* Iteration 3: Approximately 0.040
* Iteration 4: Approximately 0.040
* Iteration 5: Approximately 0.030
### Key Observations
* Both methods show a decrease in average correct flips as the iteration number increases.
* The "Multiple-choice" method starts with a higher average correct flips than the "Generation" method in the first iteration.
* Both methods converge to a similar average correct flips value by the fifth iteration.
* The shaded regions indicate the variability in the data, with the "Multiple-choice" method showing a wider range of variability.
### Interpretation
The chart suggests that both the "Generation" and "Multiple-choice" methods become less effective at producing correct flips as the number of iterations increases. This could be due to factors such as the complexity of the task, the learning process of the models, or the nature of the data being used. The convergence of the two methods by the fifth iteration suggests that they may be approaching a similar performance limit. The wider variability in the "Multiple-choice" method could indicate that its performance is more sensitive to certain factors or conditions.