## Line Chart: Average Correct Flips Over Iterations
### Overview
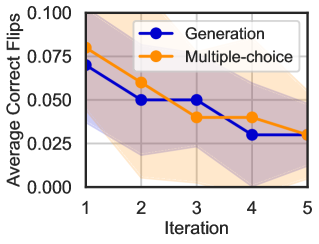
The image is a line chart comparing the performance of two methods, "Generation" and "Multiple-choice," across five iterations. The performance metric is "Average Correct Flips." Both methods show a general downward trend in performance over time, with overlapping confidence intervals (shaded regions) suggesting variability in the results.
### Components/Axes
* **Chart Type:** Line chart with shaded confidence intervals.
* **Y-Axis:**
* **Label:** "Average Correct Flips"
* **Scale:** Linear, ranging from 0.000 to 0.100.
* **Ticks:** 0.000, 0.025, 0.050, 0.075, 0.100.
* **X-Axis:**
* **Label:** "Iteration"
* **Scale:** Discrete, with integer values.
* **Ticks:** 1, 2, 3, 4, 5.
* **Legend:**
* **Position:** Top-right corner of the plot area.
* **Series 1:** "Generation" - Represented by a blue line with circular markers.
* **Series 2:** "Multiple-choice" - Represented by an orange line with circular markers.
* **Confidence Intervals:** Shaded regions around each line, indicating the range of uncertainty or variance for each data point. The "Generation" interval is shaded in a light blue/purple, and the "Multiple-choice" interval is shaded in a light orange/tan.
### Detailed Analysis
**Data Series: Generation (Blue Line)**
* **Trend:** The line shows a general downward trend with a plateau between iterations 2 and 3.
* **Data Points (Approximate):**
* Iteration 1: ~0.070
* Iteration 2: ~0.050
* Iteration 3: ~0.050
* Iteration 4: ~0.030
* Iteration 5: ~0.030
* **Confidence Interval:** The shaded blue region is widest at iteration 1 (spanning roughly 0.045 to 0.095) and narrows considerably by iteration 5 (spanning roughly 0.015 to 0.045).
**Data Series: Multiple-choice (Orange Line)**
* **Trend:** The line shows a consistent downward trend across all iterations.
* **Data Points (Approximate):**
* Iteration 1: ~0.080
* Iteration 2: ~0.060
* Iteration 3: ~0.040
* Iteration 4: ~0.040
* Iteration 5: ~0.030
* **Confidence Interval:** The shaded orange region is also widest at iteration 1 (spanning roughly 0.055 to 0.105) and narrows by iteration 5 (spanning roughly 0.015 to 0.045).
### Key Observations
1. **Initial Performance Gap:** At iteration 1, the "Multiple-choice" method starts with a higher average correct flips value (~0.080) compared to the "Generation" method (~0.070).
2. **Converging Performance:** The performance of both methods converges by the final iteration (5), with both data points at approximately 0.030.
3. **Overlapping Confidence Intervals:** The shaded confidence intervals for both methods overlap significantly at every iteration. This visual overlap suggests that the difference in performance between the two methods may not be statistically significant at any given point.
4. **Plateau in Generation:** The "Generation" method's performance does not decrease between iterations 2 and 3, unlike the "Multiple-choice" method which continues to decline.
5. **Narrowing Variance:** The confidence intervals for both methods narrow as iterations increase, indicating that the results become more consistent or less variable over time.
### Interpretation
The chart demonstrates that both the "Generation" and "Multiple-choice" methods experience a decline in the "Average Correct Flips" metric as the iterative process progresses. This could indicate that the task becomes more difficult with each iteration, or that the methods are being applied to increasingly challenging cases.
The initial advantage of the "Multiple-choice" method diminishes over time, leading to equivalent final performance. The significant overlap in confidence intervals is a critical finding; it implies that any observed difference in the average values between the two methods at a specific iteration could be due to random variation rather than a true difference in effectiveness. Therefore, based solely on this visual data, one cannot confidently conclude that one method is superior to the other at any stage.
The narrowing confidence intervals suggest that the process or the methods themselves become more stable and predictable with repeated iterations. The plateau in the "Generation" method's performance is an interesting anomaly that might warrant further investigation into what occurred between iterations 2 and 3 to halt its decline temporarily.