## Loss Curves for Log KL and Causal LM with Varying HRM Values
### Overview
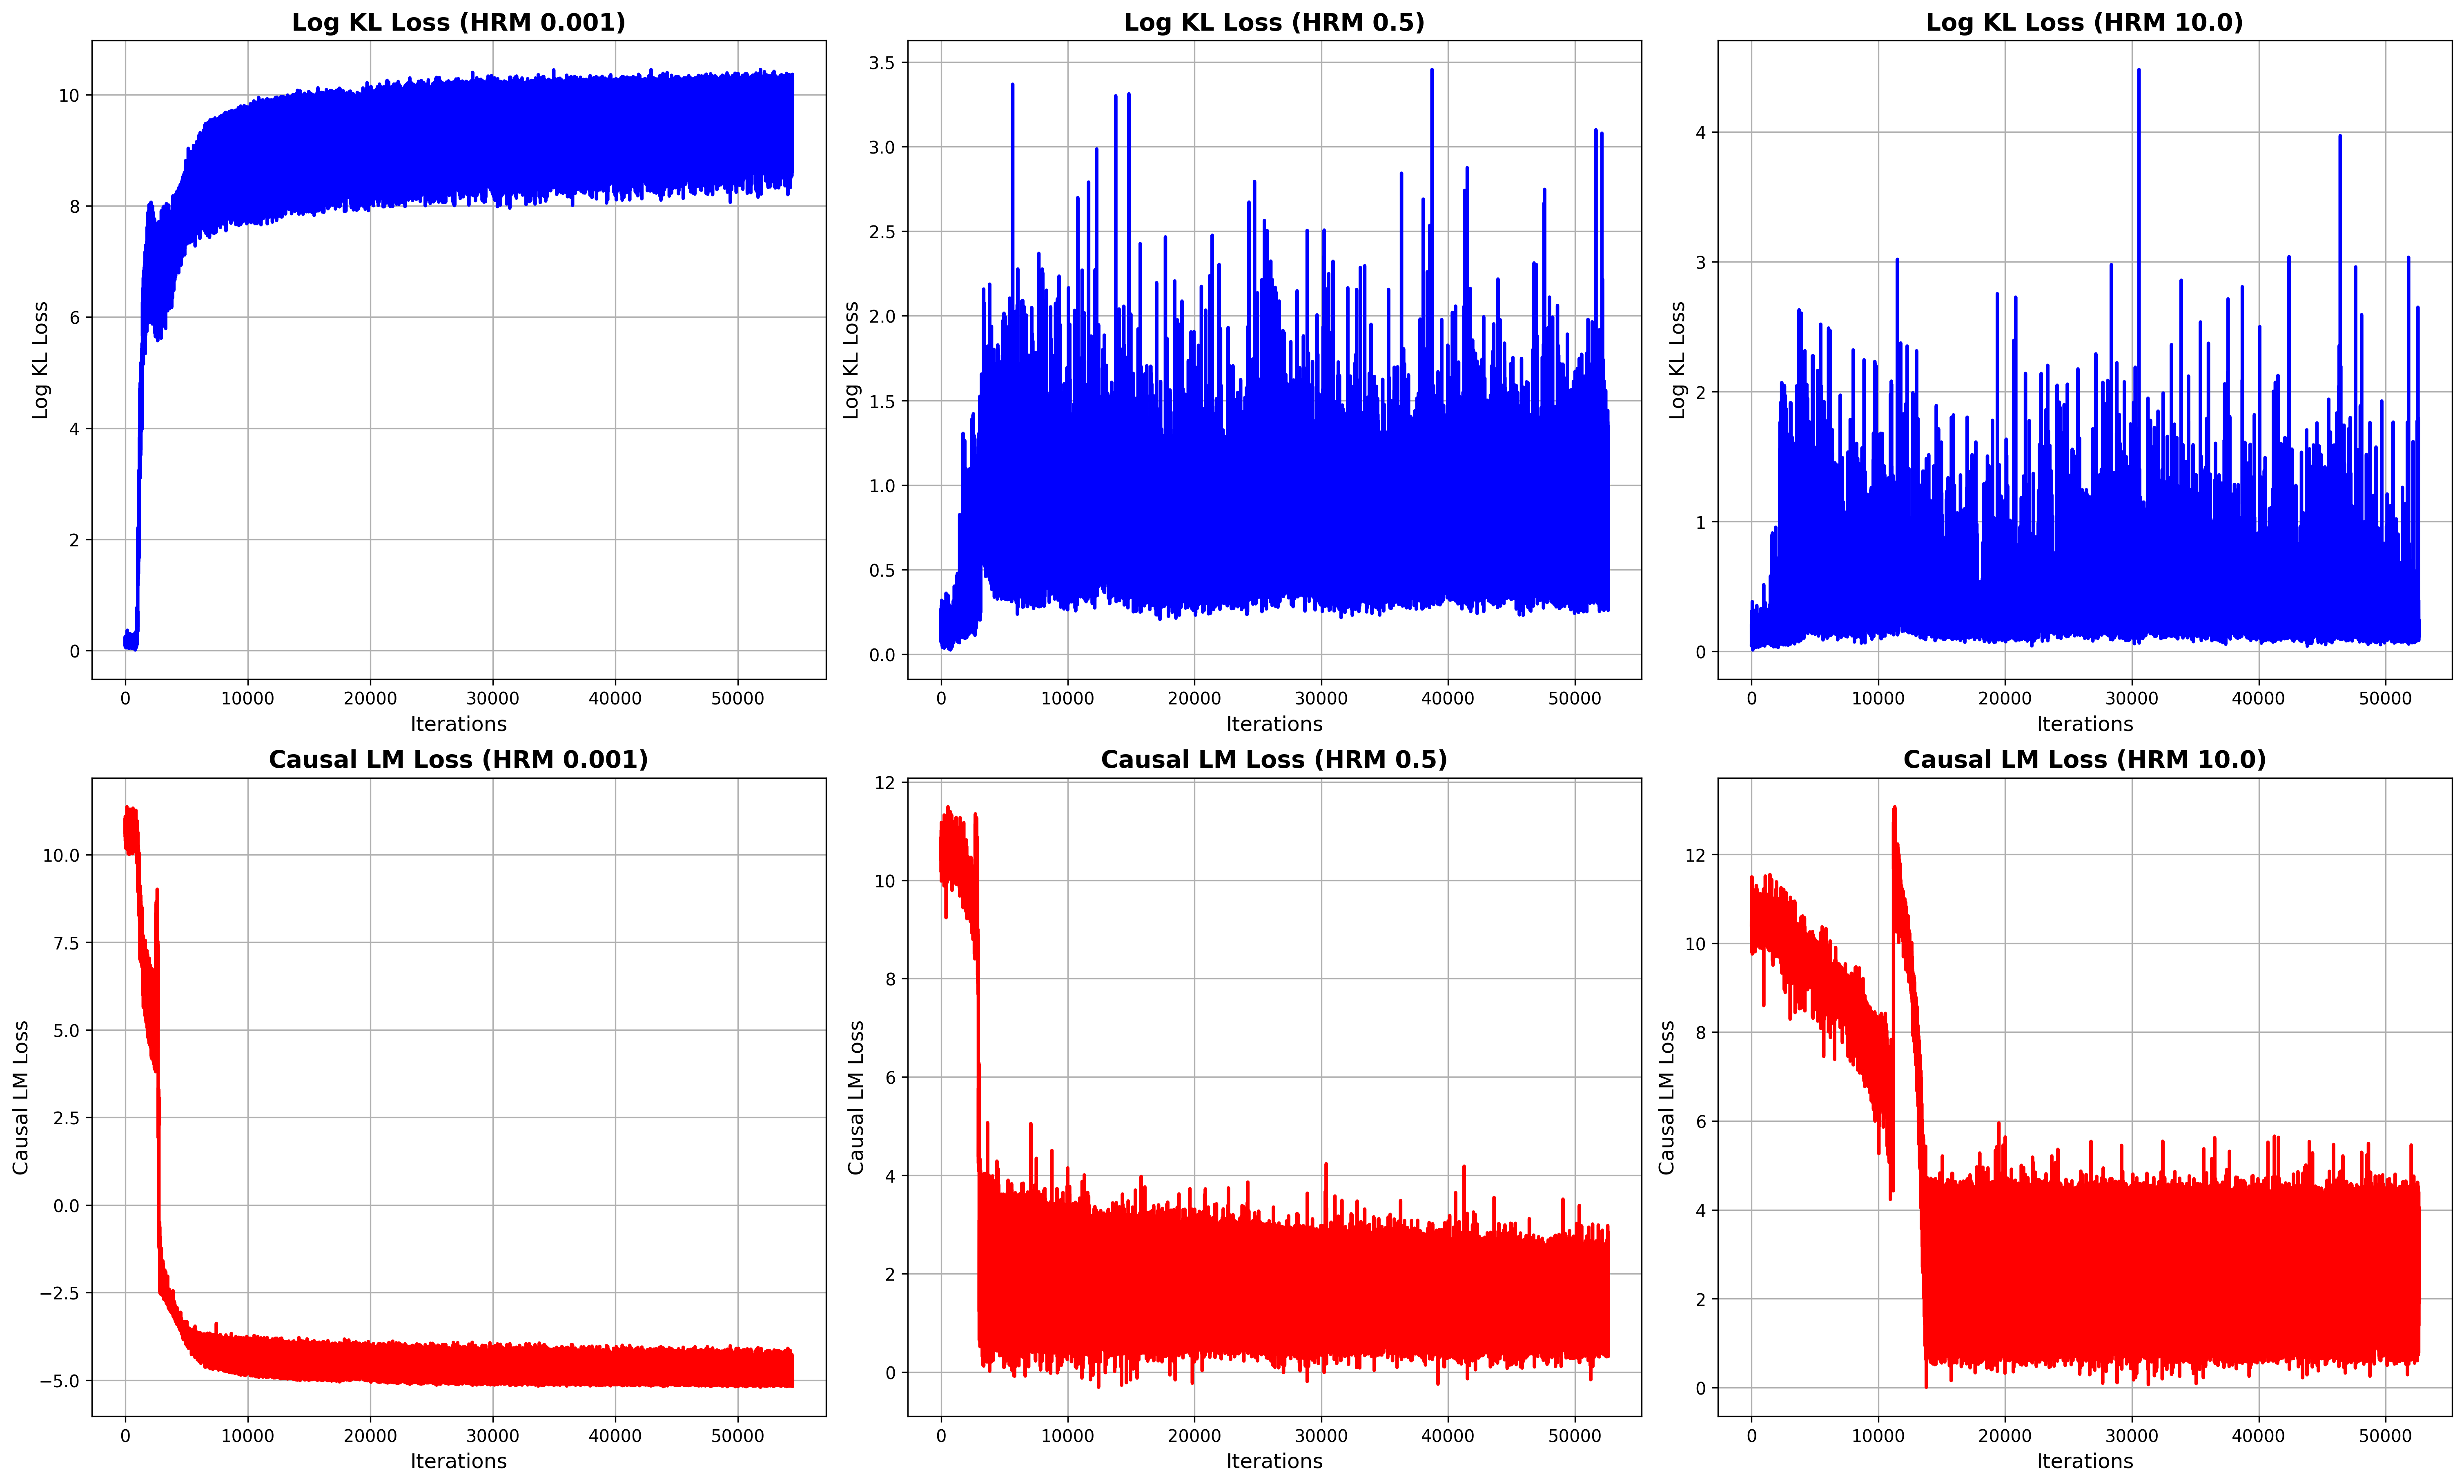
The image presents six line charts arranged in a 2x3 grid. The top row displays "Log KL Loss" against "Iterations" for three different HRM (Hyperparameter Ratio Metric) values: 0.001, 0.5, and 10.0. The bottom row mirrors this structure, but for "Causal LM Loss." The x-axis, "Iterations," is consistent across all charts, ranging from 0 to 50000. The y-axes vary in scale depending on the loss type and HRM value.
### Components/Axes
* **Titles:**
* Top-left: "Log KL Loss (HRM 0.001)"
* Top-middle: "Log KL Loss (HRM 0.5)"
* Top-right: "Log KL Loss (HRM 10.0)"
* Bottom-left: "Causal LM Loss (HRM 0.001)"
* Bottom-middle: "Causal LM Loss (HRM 0.5)"
* Bottom-right: "Causal LM Loss (HRM 10.0)"
* **X-axis:**
* Label: "Iterations"
* Range: 0 to 50000, with gridlines at approximately 10000 intervals.
* **Y-axis (Log KL Loss):**
* Label: "Log KL Loss"
* Top-left: Range 0 to 10, with gridlines at intervals of 2.
* Top-middle: Range 0.0 to 3.5, with gridlines at intervals of 0.5.
* Top-right: Range 0 to 4, with gridlines at intervals of 1.
* **Y-axis (Causal LM Loss):**
* Label: "Causal LM Loss"
* Bottom-left: Range -5.0 to 10.0, with gridlines at intervals of 2.5.
* Bottom-middle: Range 0 to 12, with gridlines at intervals of 2.
* Bottom-right: Range 0 to 12, with gridlines at intervals of 2.
* **Data Series:**
* Log KL Loss: Blue line
* Causal LM Loss: Red line
### Detailed Analysis
**Top Row: Log KL Loss**
* **Log KL Loss (HRM 0.001):**
* Trend: The blue line starts near 0, rapidly increases to approximately 8 by 10000 iterations, and then plateaus with minor fluctuations around 8-10 for the remaining iterations.
* Data Points: Initial value ~0, peak value ~10, plateau value ~8.
* **Log KL Loss (HRM 0.5):**
* Trend: The blue line starts near 0, increases to approximately 1.5 by 5000 iterations, and then fluctuates significantly between 0 and 3.5 for the remaining iterations.
* Data Points: Initial value ~0, peak value ~3.5, average value ~1.
* **Log KL Loss (HRM 10.0):**
* Trend: The blue line starts near 0, increases to approximately 1 by 5000 iterations, and then fluctuates significantly between 0 and 4 for the remaining iterations.
* Data Points: Initial value ~0, peak value ~4, average value ~1.
**Bottom Row: Causal LM Loss**
* **Causal LM Loss (HRM 0.001):**
* Trend: The red line starts at approximately 11, rapidly decreases to approximately -4 by 10000 iterations, and then plateaus with minor fluctuations around -4 to -5 for the remaining iterations.
* Data Points: Initial value ~11, minimum value ~-5, plateau value ~-4.
* **Causal LM Loss (HRM 0.5):**
* Trend: The red line starts at approximately 12, rapidly decreases to approximately 4 by 5000 iterations, and then fluctuates significantly between 0 and 6 for the remaining iterations.
* Data Points: Initial value ~12, average value ~3.
* **Causal LM Loss (HRM 10.0):**
* Trend: The red line starts at approximately 12, rapidly decreases to approximately 2 by 15000 iterations, and then fluctuates significantly between 0 and 4 for the remaining iterations.
* Data Points: Initial value ~12, average value ~2.
### Key Observations
* For Log KL Loss, a lower HRM value (0.001) results in a more stable and higher loss value after the initial increase. Higher HRM values (0.5 and 10.0) lead to more volatile loss curves.
* For Causal LM Loss, a lower HRM value (0.001) results in a more stable and lower loss value after the initial decrease. Higher HRM values (0.5 and 10.0) lead to more volatile loss curves.
* The "Iterations" axis is consistent across all plots, allowing for direct comparison of convergence speed and stability.
* The scales of the Y-axes differ, reflecting the different magnitudes of the loss values for each loss type and HRM value.
### Interpretation
The charts illustrate the impact of the HRM hyperparameter on the training dynamics of two different loss functions: Log KL Loss and Causal LM Loss. The results suggest that a lower HRM value (0.001) leads to more stable convergence for both loss functions, albeit at different final loss values. Higher HRM values (0.5 and 10.0) result in more volatile training, potentially indicating instability or a slower convergence rate. The choice of HRM value appears to be a critical factor in achieving stable and efficient training for these models. The data suggests that for this particular setup, an HRM of 0.001 is preferable, as it leads to a stable loss value for both Log KL Loss and Causal LM Loss.