\n
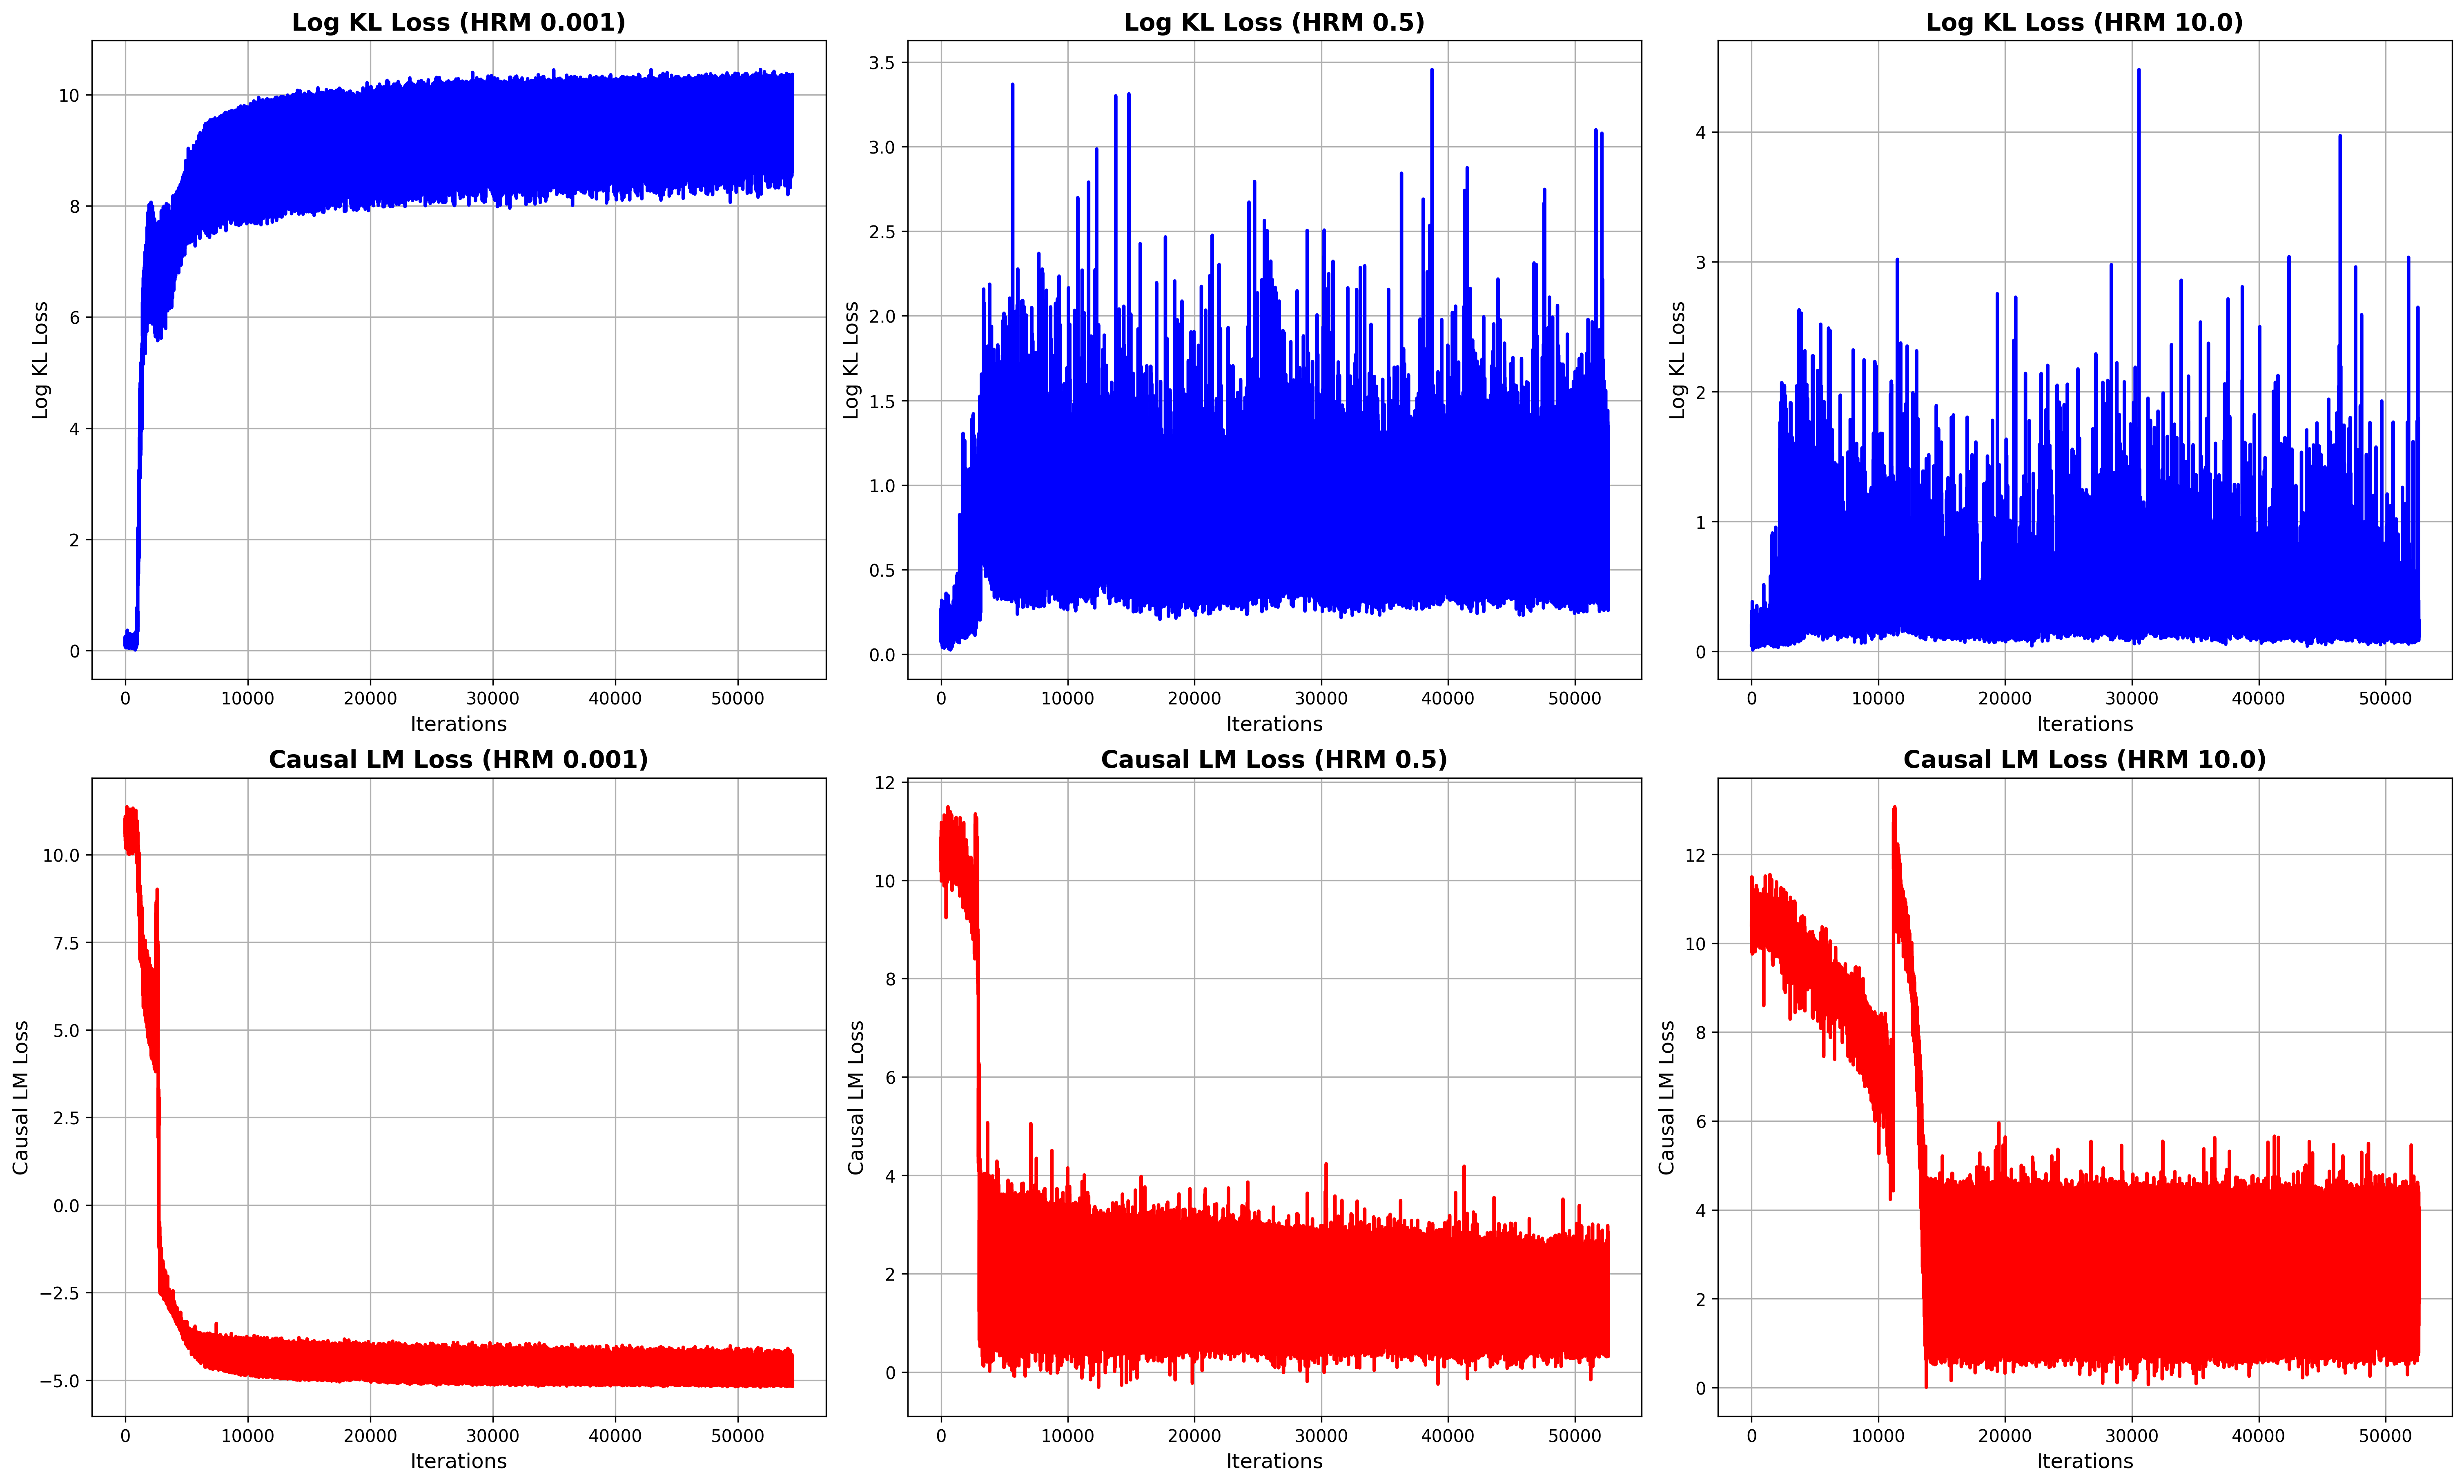
## Charts: Loss Curves for Different HRM Values
### Overview
The image presents six line charts displaying loss curves during training iterations. Each chart represents a different loss function (Log KL Loss and Causal LM Loss) evaluated at three different HRM (Hidden Representation Masking) values: 0.001, 0.5, and 10.0. The x-axis represents the number of iterations, ranging from 0 to 50000. The y-axis represents the loss value, with different scales for each chart.
### Components/Axes
* **X-axis (all charts):** Iterations (0 to 50000)
* **Y-axis (Top Row):** Log KL Loss (scales vary)
* **Y-axis (Bottom Row):** Causal LM Loss (scales vary)
* **Titles:** Each chart has a title indicating the loss function and HRM value.
* Log KL Loss (HRM 0.001)
* Log KL Loss (HRM 0.5)
* Log KL Loss (HRM 10.0)
* Causal LM Loss (HRM 0.001)
* Causal LM Loss (HRM 0.5)
* Causal LM Loss (HRM 10.0)
* **Data Series:** Each chart contains a single blue (for Log KL Loss) or red (for Causal LM Loss) line representing the loss value over iterations.
### Detailed Analysis or Content Details
**1. Log KL Loss (HRM 0.001):**
* Trend: The line starts at approximately 8.5 and decreases rapidly to around 1.0 within the first 1000 iterations. After that, it fluctuates around a value of approximately 1.0, with minor oscillations.
* Data Points (approximate):
* Iteration 0: Loss ≈ 8.5
* Iteration 1000: Loss ≈ 1.0
* Iteration 50000: Loss ≈ 1.0
**2. Log KL Loss (HRM 0.5):**
* Trend: The line starts at approximately 3.0 and decreases to around 0.5 within the first 1000 iterations. It then exhibits significant fluctuations, oscillating between approximately 0.5 and 3.0 throughout the remaining iterations.
* Data Points (approximate):
* Iteration 0: Loss ≈ 3.0
* Iteration 1000: Loss ≈ 0.5
* Iteration 50000: Loss ≈ 2.0
**3. Log KL Loss (HRM 10.0):**
* Trend: The line starts at approximately 4.0 and decreases to around 1.0 within the first 1000 iterations. It then fluctuates significantly, oscillating between approximately 1.0 and 4.0 throughout the remaining iterations.
* Data Points (approximate):
* Iteration 0: Loss ≈ 4.0
* Iteration 1000: Loss ≈ 1.0
* Iteration 50000: Loss ≈ 3.0
**4. Causal LM Loss (HRM 0.001):**
* Trend: The line starts at approximately 10.0 and decreases rapidly to around -5.0 within the first 1000 iterations. After that, it remains relatively stable around -5.0, with minor fluctuations.
* Data Points (approximate):
* Iteration 0: Loss ≈ 10.0
* Iteration 1000: Loss ≈ -1.0
* Iteration 50000: Loss ≈ -5.0
**5. Causal LM Loss (HRM 0.5):**
* Trend: The line starts at approximately 12.0 and decreases to around 2.0 within the first 1000 iterations. It then fluctuates significantly, oscillating between approximately 2.0 and 10.0 throughout the remaining iterations.
* Data Points (approximate):
* Iteration 0: Loss ≈ 12.0
* Iteration 1000: Loss ≈ 2.0
* Iteration 50000: Loss ≈ 4.0
**6. Causal LM Loss (HRM 10.0):**
* Trend: The line starts at approximately 12.0 and decreases to around 2.0 within the first 1000 iterations. It then fluctuates significantly, oscillating between approximately 2.0 and 10.0 throughout the remaining iterations.
* Data Points (approximate):
* Iteration 0: Loss ≈ 12.0
* Iteration 1000: Loss ≈ 2.0
* Iteration 50000: Loss ≈ 6.0
### Key Observations
* Lower HRM values (0.001) generally lead to more stable loss curves, especially for Causal LM Loss.
* Higher HRM values (0.5 and 10.0) result in more volatile loss curves, indicating potentially unstable training dynamics.
* Log KL Loss appears to converge to a relatively stable value for HRM 0.001, while it continues to fluctuate for higher HRM values.
* Causal LM Loss exhibits a strong decreasing trend initially for all HRM values, but the stability varies significantly.
### Interpretation
The charts demonstrate the impact of the HRM value on the training dynamics of the model. A very low HRM (0.001) seems to promote stable training, particularly for the Causal LM Loss, leading to convergence. However, increasing the HRM value introduces instability, as evidenced by the fluctuating loss curves. This suggests that masking a larger portion of the hidden representation (higher HRM) makes the training process more sensitive to the initial conditions and potentially hinders convergence. The differences in behavior between Log KL Loss and Causal LM Loss suggest that these loss functions respond differently to the masking strategy. The initial rapid decrease in Causal LM Loss across all HRM values indicates that the model quickly learns to predict the masked tokens, but the subsequent fluctuations suggest that maintaining this prediction accuracy becomes more challenging with higher HRM values. The data suggests that there is an optimal HRM value that balances the benefits of masking with the need for stable training. Further investigation would be needed to determine this optimal value.