## Line Graphs: Log KL Loss and Causal LM Loss Across HRM Values
### Overview
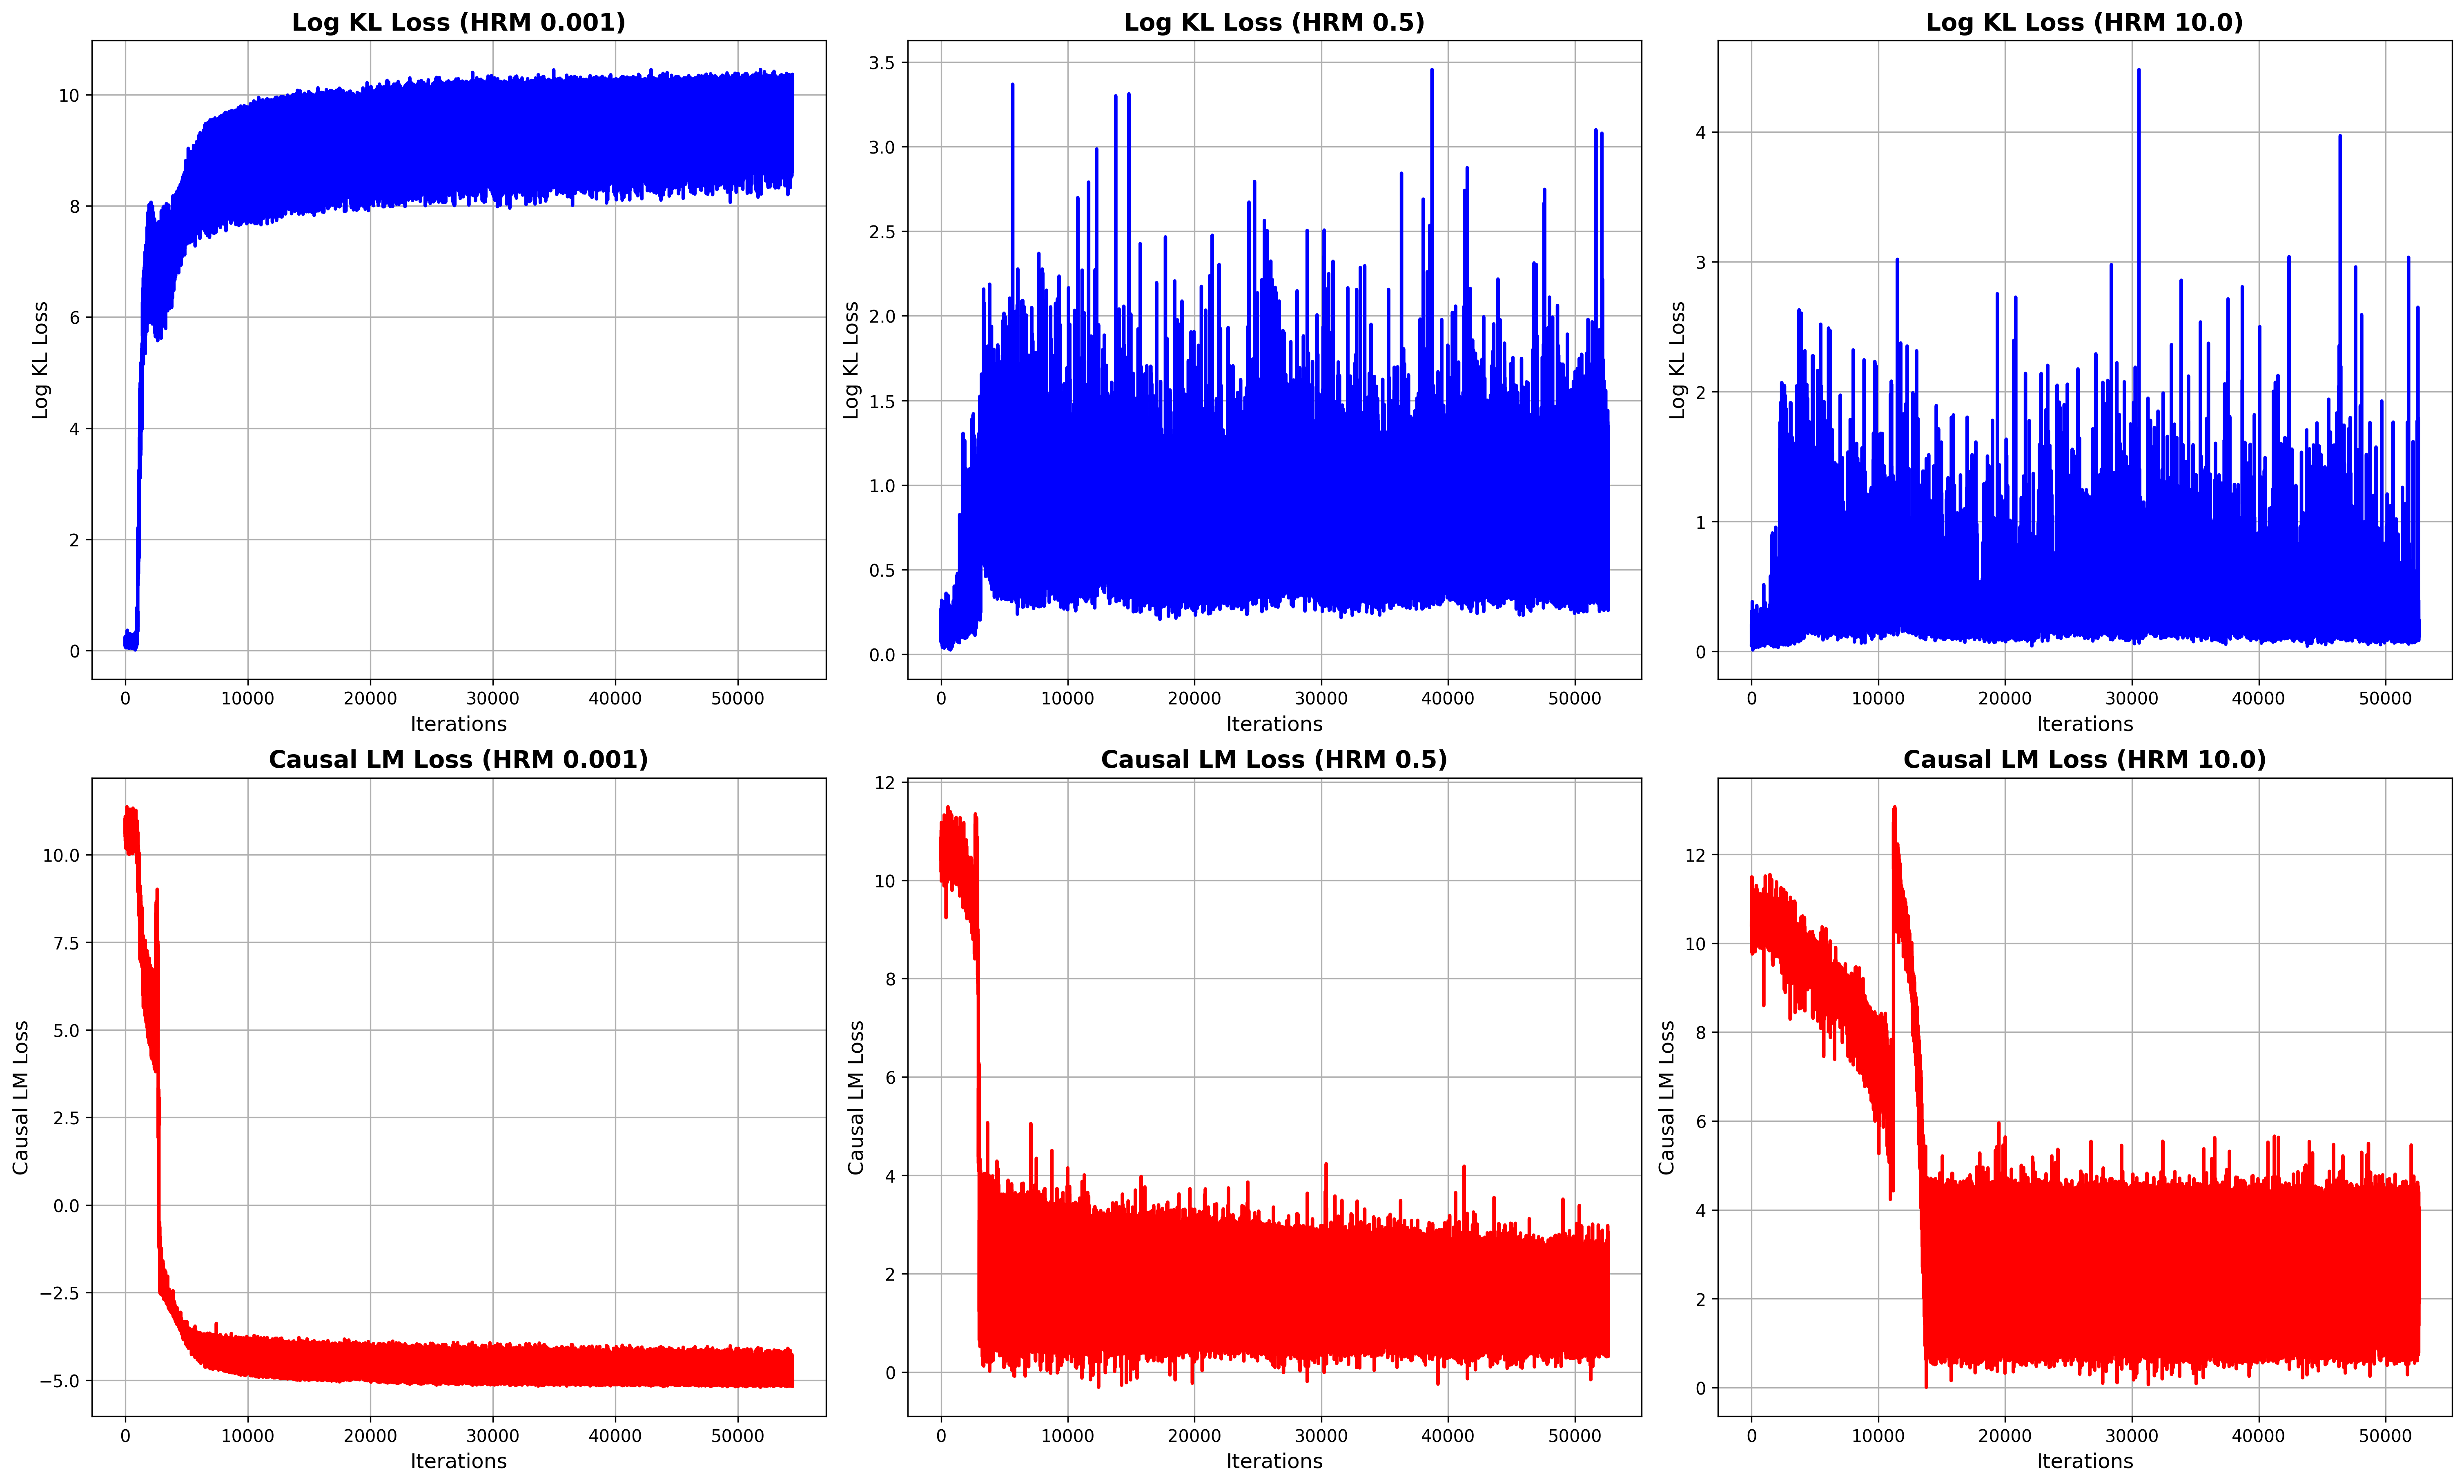
The image contains six line graphs comparing **Log KL Loss** (top row) and **Causal LM Loss** (bottom row) across three Hyperparameter (HRM) values: **0.001**, **0.5**, and **10.0**. Each graph tracks loss values over **50,000 iterations**, with distinct trends observed for different HRM settings.
---
### Components/Axes
1. **X-Axis**: Labeled "Iterations" (0 to 50,000 in increments of 10,000).
2. **Y-Axis**:
- Top row: "Log KL Loss" (0 to 12, logarithmic scale).
- Bottom row: "Causal LM Loss" (0 to 12, linear scale).
3. **Legends**:
- Blue lines represent **Log KL Loss**.
- Red lines represent **Causal LM Loss**.
4. **Graph Titles**:
- Top row: "Log KL Loss (HRM X.X)".
- Bottom row: "Causal LM Loss (HRM X.X)".
---
### Detailed Analysis
#### Log KL Loss (Top Row)
1. **HRM 0.001**:
- Line starts at ~10, drops sharply to ~8 within 1,000 iterations, then stabilizes near **8.5**.
- Minimal fluctuation after initial drop.
2. **HRM 0.5**:
- Line oscillates between **1.5** and **3.5** with frequent spikes.
- No clear convergence; high volatility.
3. **HRM 10.0**:
- Line starts at ~2, spikes to ~4, then fluctuates between **1.5** and **3.5**.
- Persistent instability with sharp peaks.
#### Causal LM Loss (Bottom Row)
1. **HRM 0.001**:
- Line starts at ~10, drops sharply to **-5** within 1,000 iterations, then stabilizes near **-5**.
- Sharp initial decline followed by flatline.
2. **HRM 0.5**:
- Line starts at ~10, drops to ~2 within 1,000 iterations, then fluctuates between **1.5** and **4**.
- Moderate volatility after initial drop.
3. **HRM 10.0**:
- Line starts at ~10, drops to ~4 within 1,000 iterations, then stabilizes near **4**.
- Sharp initial drop but higher baseline than lower HRM values.
---
### Key Observations
1. **Log KL Loss**:
- Lower HRM (0.001) shows rapid convergence and stability.
- Higher HRM (10.0) exhibits persistent instability with frequent spikes.
- HRM 0.5 balances between volatility and partial convergence.
2. **Causal LM Loss**:
- All HRM values show sharp initial declines, but lower HRM achieves deeper minima.
- Higher HRM (10.0) stabilizes at a higher loss value than lower HRM settings.
3. **Inverse Relationship**:
- Lower HRM correlates with lower final Log KL Loss but higher final Causal LM Loss.
- Higher HRM correlates with higher final Log KL Loss but lower final Causal LM Loss.
---
### Interpretation
1. **HRM Impact on Training Dynamics**:
- **Low HRM (0.001)**: Prioritizes stability in Log KL Loss but may underfit Causal LM objectives.
- **High HRM (10.0)**: Encourages exploration (higher Log KL Loss) but risks instability in Causal LM training.
- **Intermediate HRM (0.5)**: Balances exploration and stability but lacks clear convergence.
2. **Loss Trade-offs**:
- The inverse relationship between Log KL and Causal LM Loss suggests a tension between model fidelity (KL divergence) and predictive performance (Causal LM).
- Lower HRM values may improve alignment with a reference distribution (KL) but sacrifice generalization (Causal LM).
3. **Anomalies**:
- HRM 10.0 in Log KL Loss shows extreme spikes, indicating potential overfitting or optimization instability.
- Causal LM Loss for HRM 0.001 achieves the lowest value (-5), suggesting optimal alignment with training objectives but possible over-specialization.
---
### Spatial Grounding
- **Legends**: Positioned in the top-right corner of each graph, matching line colors (blue for Log KL, red for Causal LM).
- **Axis Labels**: Centered on respective axes, with clear numerical increments.
- **Graph Titles**: Centered above each plot, explicitly stating HRM values.
---
### Conclusion
The data demonstrates that HRM values critically influence training stability and convergence behavior. Lower HRM settings favor stable, low-loss trajectories in Log KL Loss but may limit Causal LM performance. Higher HRM values encourage exploration but introduce volatility. These trade-offs highlight the need for careful HRM tuning to balance model alignment and generalization.