## Line Chart: Comparison of KNN and SVM Predictions over Time
### Overview
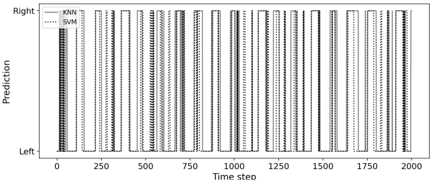
This image displays a step-plot line chart comparing the binary classification predictions of two machine learning models—K-Nearest Neighbors (KNN) and Support Vector Machine (SVM)—across 2000 time steps. The chart illustrates how frequently each model switches its prediction between two states: "Left" and "Right."
### Components/Axes
* **X-Axis:** Labeled "Time step". The scale ranges from 0 to 2000, with major tick marks at intervals of 250 (0, 250, 500, 750, 1000, 1250, 1500, 1750, 2000).
* **Y-Axis:** Labeled "Prediction". This is a binary categorical axis with two distinct states: "Left" (positioned at the bottom) and "Right" (positioned at the top).
* **Legend:** Located in the top-left corner of the chart area.
* **Solid line:** Labeled "KNN"
* **Dotted line:** Labeled "SVM"
### Detailed Analysis
* **Trend Verification:** Both data series exhibit a "square wave" pattern, indicating rapid, discrete switching between the two states ("Left" and "Right"). There is no gradual transition; the lines move vertically between the two states.
* **Data Series Correlation:**
* **KNN (Solid Line):** The KNN model oscillates frequently between "Left" and "Right" throughout the entire 2000-step duration.
* **SVM (Dotted Line):** The SVM model follows an almost identical pattern to the KNN model.
* **Synchronization:** The two lines are highly synchronized. When the KNN line switches from "Left" to "Right" (or vice versa), the SVM line almost invariably switches at the same time step.
* **Distribution:**
* **0–250:** Both models start at "Left," switch to "Right" around step 30-40, then switch back to "Left" around step 60-70. This pattern repeats several times within the first 250 steps.
* **250–1000:** The frequency of switching remains high and consistent.
* **1000–2000:** The behavior remains consistent with the earlier segments, showing no significant change in the frequency of state changes.
### Key Observations
* **High Agreement:** There is a near-perfect correlation between the KNN and SVM predictions. The models appear to be making identical classification decisions at almost every time step.
* **High-Frequency Switching:** The system being modeled is highly dynamic. The predictions do not stay in one state for long periods; they switch states frequently, suggesting either a highly volatile input signal or a system that requires rapid, continuous adjustment.
* **Consistency:** The switching behavior is uniform across the entire 2000-step range; there is no evidence of the models "settling" or diverging over time.
### Interpretation
* **What the data demonstrates:** The data suggests that the underlying classification task is likely straightforward or that the input features are highly distinct, as two fundamentally different algorithms (KNN, a distance-based classifier, and SVM, a margin-based classifier) are producing nearly identical outputs.
* **Why it matters:** In a real-world application (such as a Brain-Computer Interface or robotic control), this level of rapid, synchronized switching might indicate "chatter" or instability. If the goal is to control a device, the frequent switching between "Left" and "Right" might be undesirable unless the system is specifically designed to react to high-frequency changes.
* **Reading between the lines:** The fact that both models behave identically suggests that the decision boundary in the feature space is very clear. If the models were struggling with ambiguity, one would expect to see divergence between the KNN and SVM predictions. The lack of divergence implies that both models are capturing the same ground truth signal with high fidelity.