## Chart: IsoLoss Contours and IsoFLOPs Slices
### Overview
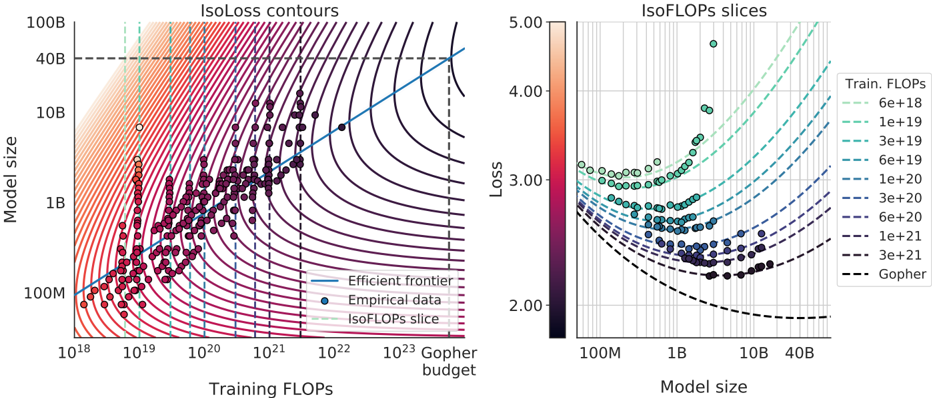
The image presents a two-part chart exploring the relationship between model size, training FLOPs (Floating Point Operations), and loss. The left side displays IsoLoss contours, showing lines of equal loss for different combinations of model size and training FLOPs. The right side shows IsoFLOPs slices, illustrating how loss varies with model size for specific training FLOPs budgets. Both charts are overlaid with empirical data points.
### Components/Axes
**Left Chart (IsoLoss Contours):**
* **X-axis:** Training FLOPs (logarithmic scale, from 10<sup>18</sup> to 10<sup>23</sup>). Labeled "Training FLOPs".
* **Y-axis:** Model Size (logarithmic scale, from 100M to 100B). Labeled "Model size".
* **Contours:** Lines representing constant loss values.
* **Data Points:** Scatter plot of "Empirical data" in dark purple.
* **Line:** "Efficient frontier" in blue.
* **Line:** "IsoFLOPs slice" in black.
* **Vertical Line:** "Gopher budget" in teal.
**Right Chart (IsoFLOPs Slices):**
* **X-axis:** Model Size (logarithmic scale, from 100M to 40B). Labeled "Model size".
* **Y-axis:** Loss (linear scale, from 2.00 to 5.00). Labeled "Loss".
* **Lines:** Curves representing different training FLOPs budgets.
* **Data Points:** Scatter plot of "IsoFLOPs slice" in light green.
* **Line:** "Gopher" in black.
**Legend (Right Chart):**
* 6e+18 (cyan)
* 1e+19 (light blue)
* 3e+19 (teal)
* 6e+19 (dark teal)
* 1e+20 (purple)
* 3e+20 (dark purple)
* 6e+20 (navy)
* 1e+21 (dark navy)
* 3e+21 (black)
**Colorbar (Right Chart):**
* Represents Loss, ranging from dark gray (low loss ~2.0) to red (high loss ~5.0).
### Detailed Analysis or Content Details
**Left Chart (IsoLoss Contours):**
* The "Efficient frontier" line slopes upward, indicating that achieving lower loss generally requires either a larger model size or more training FLOPs.
* The "Empirical data" points are clustered around the lower-left region of the chart, with a dense concentration between 10<sup>19</sup> and 10<sup>21</sup> FLOPs and 1B to 10B model size.
* The "IsoFLOPs slice" line appears to be a vertical line at approximately 10<sup>22</sup> FLOPs.
* The "Gopher budget" vertical line is positioned around 10<sup>21</sup> FLOPs.
* IsoLoss contours are densely packed in the lower-left, indicating a steep gradient in loss. Contours become more spaced out as FLOPs and model size increase.
**Right Chart (IsoFLOPs Slices):**
* For each FLOPs budget, the loss generally decreases as model size increases, then plateaus.
* The 6e+18 line shows a rapid decrease in loss for model sizes up to approximately 1B, then levels off.
* The 1e+19 line shows a similar trend, but with a lower minimum loss.
* The 3e+19 line shows a further decrease in minimum loss.
* The 6e+19 line shows a further decrease in minimum loss.
* The 1e+20 line shows a further decrease in minimum loss.
* The 3e+20 line shows a further decrease in minimum loss.
* The 6e+20 line shows a further decrease in minimum loss.
* The 1e+21 line shows a further decrease in minimum loss.
* The 3e+21 line shows a further decrease in minimum loss.
* The "Gopher" line is relatively flat, indicating that increasing model size beyond a certain point does not significantly reduce loss for that FLOPs budget.
* The IsoFLOPs slice data points are scattered along the curves, with a concentration around the lower loss values.
### Key Observations
* There's a clear trade-off between model size, training FLOPs, and loss.
* The "Efficient frontier" represents the optimal combination of model size and FLOPs for a given loss target.
* The empirical data suggests that current models are often operating below the efficient frontier.
* The "Gopher" model appears to be operating near its optimal model size for its FLOPs budget.
* Higher FLOPs budgets generally allow for lower loss values, but with diminishing returns as model size increases.
### Interpretation
The charts demonstrate the scaling laws governing the performance of large language models. They illustrate that increasing model size and training FLOPs generally leads to lower loss, but there are diminishing returns. The "Efficient frontier" represents the theoretical limit of performance for a given computational budget. The empirical data suggests that there is room for improvement in current model training strategies. The IsoFLOPs slices provide a more detailed view of the loss landscape for different FLOPs budgets, revealing the optimal model size for each budget. The "Gopher" model serves as a benchmark, showing the performance achievable with a specific FLOPs budget. The colorbar on the right chart provides a visual representation of the loss values, allowing for a quick assessment of model performance. The logarithmic scales on both axes are crucial for visualizing the wide range of values involved in large language model training. The positioning of the legend in the top-right corner of the right chart allows for easy comparison of the different FLOPs budgets. The overall message is that careful consideration of model size, training FLOPs, and the efficient frontier is essential for maximizing the performance of large language models.