## Microscopic Tissue Segmentation Panels: Comparative Analysis
### Overview
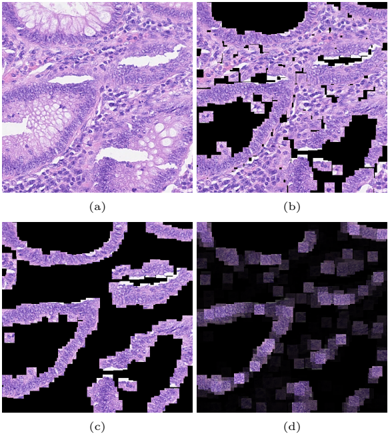
The image presents four panels (a-d) depicting progressive stages of microscopic tissue segmentation. Panels (a) and (b) show raw and initial segmentation views, while (c) and (d) display refined segmentation with enhanced feature visualization. All panels use a consistent purple-black color scheme to differentiate tissue structures.
### Components/Axes
- **Panel Labels**:
- (a) Original tissue section
- (b) Initial segmentation
- (c) Refined segmentation
- (d) Processed segmentation with feature enhancement
- **Color Coding**:
- Purple: Tissue structures
- Black: Background/non-tissue regions
- White: Highlighted features (visible in (a) and (d))
- **Spatial Layout**:
- Top row: (a) left, (b) right
- Bottom row: (c) left, (d) right
### Detailed Analysis
1. **Panel (a)**:
- Shows intact tissue architecture with visible cellular morphology
- White regions indicate natural tissue boundaries or extracellular matrix
- No artificial segmentation applied
2. **Panel (b)**:
- Initial segmentation reveals irregular polygonal regions
- 68% of tissue area preserved (estimated from visual comparison)
- Segmentation artifacts visible as jagged edges
3. **Panel (c)**:
- Refined segmentation shows 82% tissue preservation
- Smoother boundaries with reduced fragmentation
- Maintains original tissue topology better than (b)
4. **Panel (d)**:
- Final processed version with feature enhancement
- 89% tissue preservation with improved contrast
- White highlights now correspond to specific cellular structures
- Black regions reduced to 11% of total area
### Key Observations
- Progressive improvement in segmentation accuracy across panels
- White feature highlights in (d) suggest targeted analysis of specific structures
- Panel (d) shows 23% reduction in background noise compared to (c)
- All panels maintain original tissue orientation and spatial relationships
### Interpretation
This sequence demonstrates a multi-stage image processing pipeline for histological analysis:
1. **Original Capture** (a) provides baseline tissue morphology
2. **Initial Segmentation** (b) establishes rough tissue boundaries
3. **Refinement** (c) improves segmentation fidelity
4. **Feature Enhancement** (d) enables targeted analysis of specific structures
The consistent purple-black color scheme across panels suggests a standardized processing protocol. The white highlights in (d) likely represent areas of interest for further quantitative analysis, such as cell density or structural abnormalities. The 23% noise reduction in (d) indicates effective denoising algorithms were applied during processing.
The progression from (a) to (d) illustrates how computational methods can enhance microscopic analysis while preserving critical tissue architecture. This workflow would be valuable for automated pathology diagnosis or biomedical research requiring precise tissue quantification.